549: quantum of sollazzo
#549: quantum of sollazzo – 23 January 2024
The data newsletter by @puntofisso.

Hello, regular readers and welcome new ones :) This is Quantum of Sollazzo, the newsletter about all things data. I am Giuseppe Sollazzo, or @puntofisso. I've been sending this newsletter since 2012 to be a summary of all the articles with or about data that captured my attention over the previous week. The newsletter is and will always (well, for as long as I can keep going!) be free, but you're welcome to become a friend via the links below.
We have some great new sponsored content: Ed Freyfogle, organiser of location-based service meetup Geomob, co-host of the Geomob podcast, and co-founder of the OpenCage, has offered to introduce a set of points around the topic of geodata. His first entry starts a few paragraphs below on the importance of open geodata.
This initiative could be of interest to some of you: the 2nd IMPETUS open call is now accepting applications from citizen science projects.
The accelerator programme has 2 kinds of grants for citizen science projects, kickstarting grants (€20,000) and sustaining grants (€10,000), available for projects in these categories:
The Call also includes the EU prize for citizen science which recognises outstanding citizen science initiatives, with one €60,000 Grand Prize and a Diversity & Collaboration and Digital Communities awards of €20,000 each, plus 27 honorary mentions to boost recognition.
The prize call calls 11/3, and the accelerator call on 14/3. There are two webinars to help with the application process. These will happen at 14:00 CET on the 24th of January, and 9:00 CET on the 28th of February 2024.
Speaking of prizes, the The Harding Prize for Trustworthy Communication have launched. Led by Cambridge University's Winton Centre for Risk & Evidence Communication and in association with Sense About Science and the Science Media Centre, these prizes are designed to "reward those who are trying to help their audiences make up their own minds on the basis of the best evidence available: communication purely for the benefit of the audience."
Each Harding Prize is worth £3,141.59 and the judging panel includes Sir David Spiegelhalter and other big names.
The most clicked link last week was the Strait's Times look at the environmental impact of downloading a web page.
'till next week,
Giuseppe @puntofisso
|
Before you go... DO YOU LIKE QUANTUM OF SOLLAZZO? → BECOME A SUPPORTER! :) If you enjoy this newsletter, you can support it by becoming a GitHub Sponsor. Or you can Buy Me a Coffee. I'll send you an Open Data Rottweiler sticker. You're receiving this email because you subscribed to Quantum of Sollazzo, a weekly newsletter covering all things data, written by Giuseppe Sollazzo (@puntofisso). If you have a product or service to promote and want to support this newsletter, you can sponsor an issue. |
✨ Topical
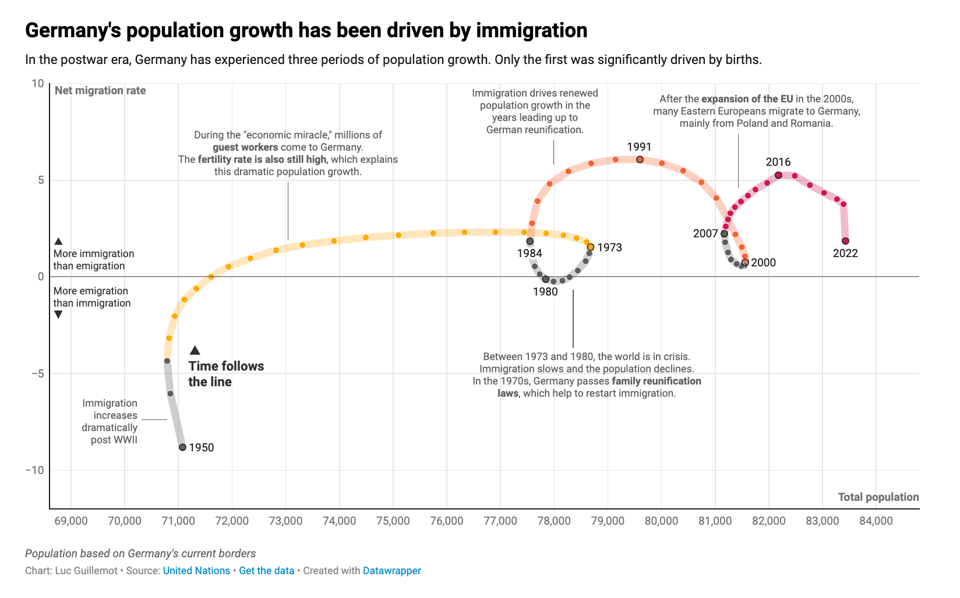
Connecting the dots of population growth in Germany
Using an often controversial chart type (the connected scatterplot – which, however, I think works well in this case), Datawrapper's Luc Guillemot shows the highs and lows of German population over the past 70 years.
Is flying safer than driving?
"There have been effectively zero deaths per 100 million passenger miles traveled by air in the US each year from 2002 to 2020."
There might be other reasons to avoid airplanes, but safety is probably not one of them, at least in the US.

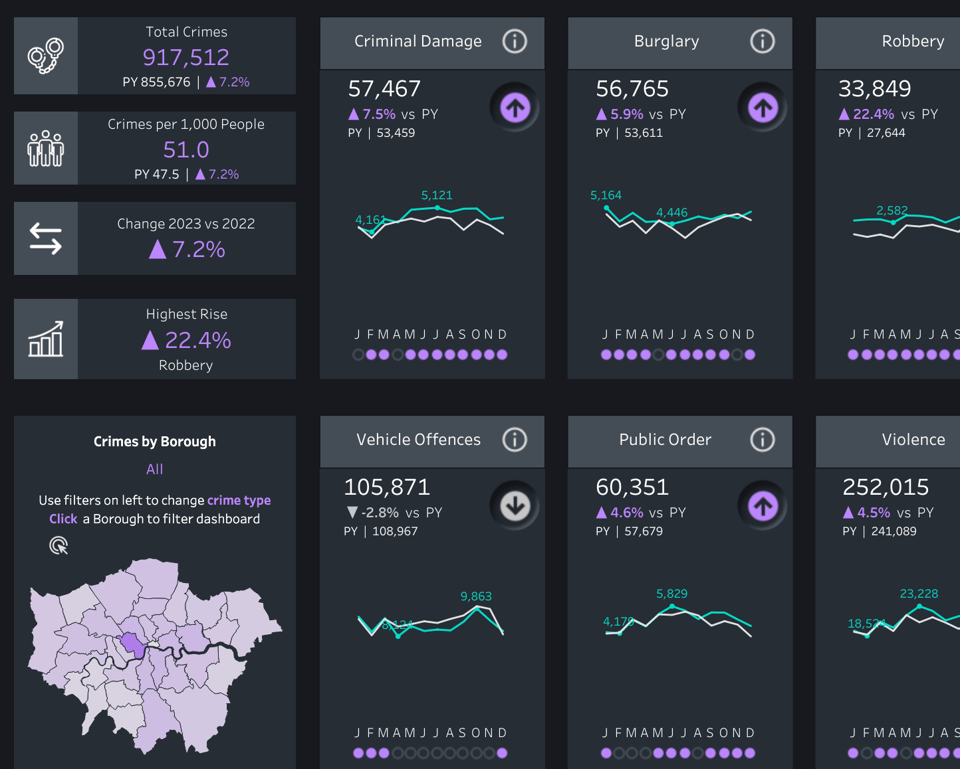
London major crimes
This Tableau board shows crime rates at borough level for 2022-2023.
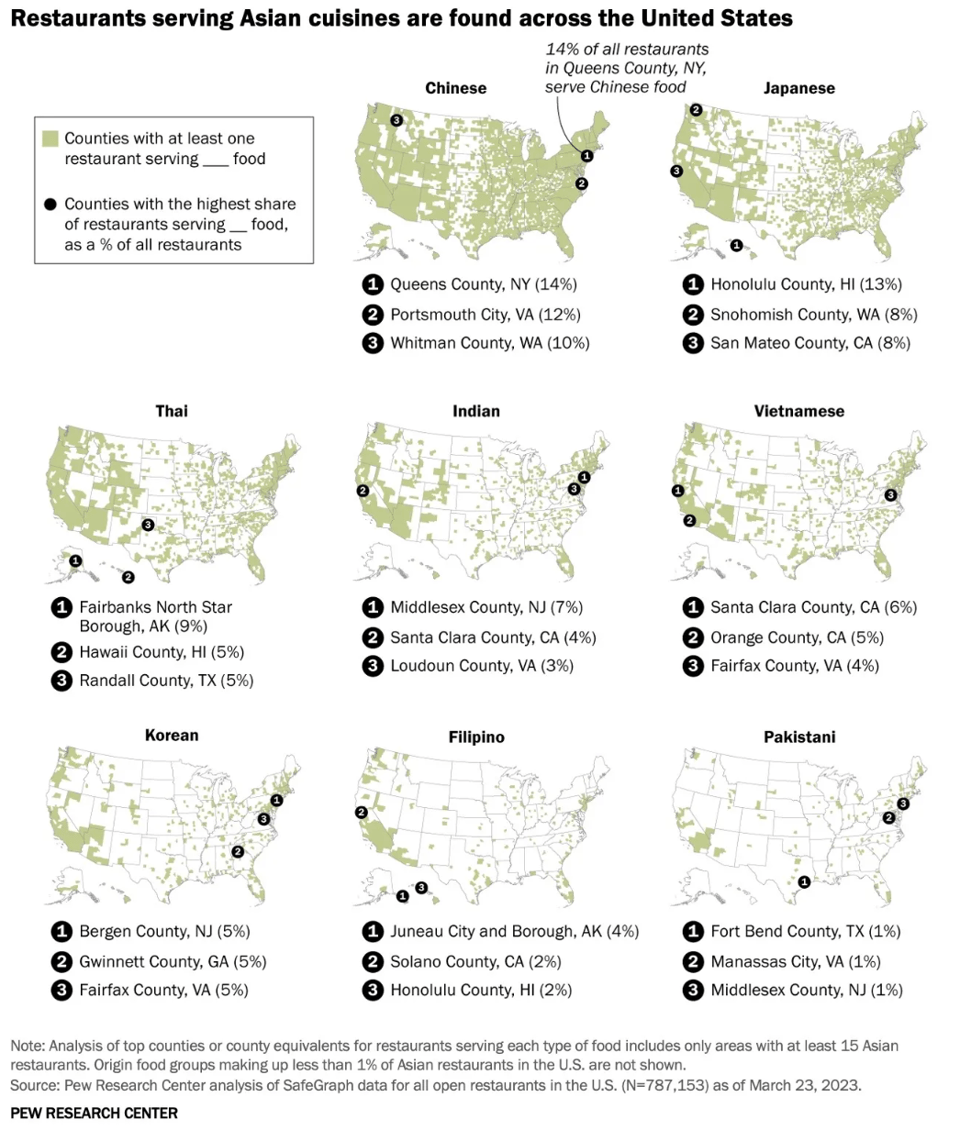
71% of Asian restaurants in the U.S. serve Chinese, Japanese or Thai food
Interesting here to see the data in comparison with the perception we have about the UK, where I think the balance is instead in favour of Indian restaurants.
Why is open geodata important? What's the difference between open and closed data?
Proprietary geodata from private services like Google are widely used, but come with licenses that severely restrict how you can use the data. Restrictions include:
- don't allow storing (caching) beyond a certain time period, and require deletion when you stop being a customer
- limit which maps you can use to display the geodata
- require a significantly higher cost to use behind a firewall or in desktop software
- no clarity on when or if data will be refreshed or corrected
Open data, like that returned by the OpenCage geocoding API, means:
- store data as long as you like
- display on any map
- use publicly or behind a firewall
- fix errors when you find them
As a final bonus, because the data is free (no cost), our service is also much more affordable.
Have a project that will need geocoding? See our geocoding buyer's guide for an overview of all the factors to consider when choosing between geocoding services. https://gist.github.com/freyfogle/3fd76a6710e724db9e616f5d84b951fb
🛠️📖 Tools & Tutorials
Geocomputation with Python
An online book, authored by a group of geo-giants, on reproducible geographic data analysis with open source software.
surya
"Accurate line-level text detection and recognition (OCR) in any language."
It looks like the actual text recognition part is still under development, but it's the first time I see such easy to use line detection system.
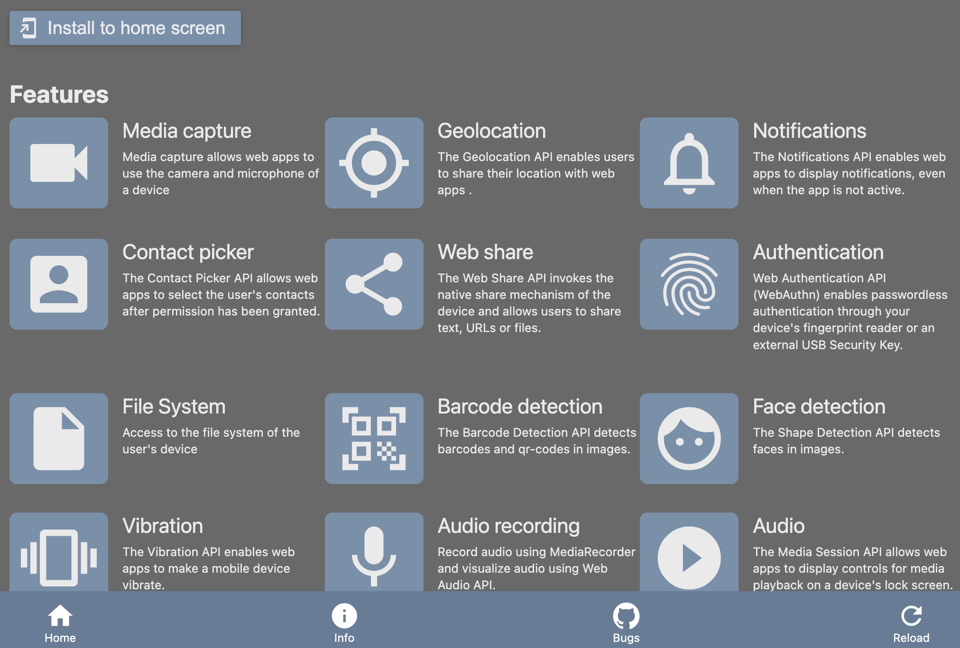
What PWA Can Do Today
Wow, I didn't know how far PWAs had progressed. If you don't know what a PWA is, it's basically an installable website that works as an app and has hardware and offline capabilities.
This website is a PWA in its own right and allows you to test the functionality.
Let's talk about joins
"...before combining data, it’s important to consider what type of join makes the most sense for our specific purposes, as well as how to correctly perform those joins. This blog post reviews the various ways we may consider combining our data."

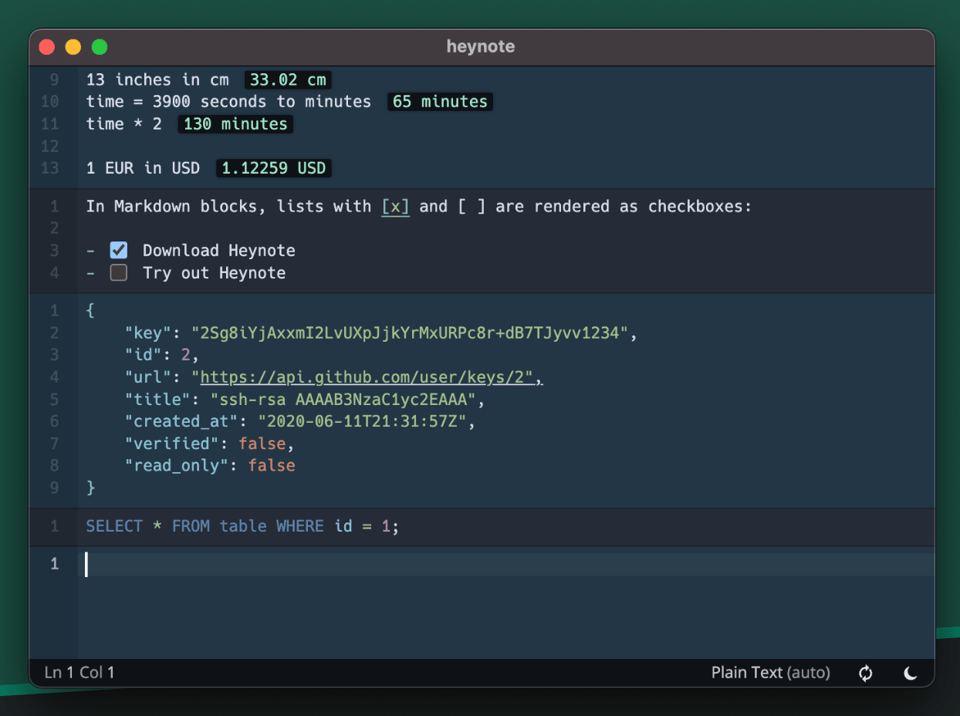
Hey note
"A dedicated scratchpad for developers". Free and open source.
SVG Icons CLI
"A command line tool for creating SVG spirte sheets and rendering them with a React Icon component."
As the README states, this tool solves the following problem: "Including SVGs in your JavaScript bundles is convenient, but slow and expensive. Using \<img> tags with SVGs isn't flexible. The best way to use icons is an SVG spritesheet, but there isn't an out-of-the-box tool to create those spritesheets."
polars’ Rgonomic Patterns
"In this follow-up post to Python Rgonomics, we deep dive into some of the advanced data wrangling functionality in python’s polars package to see how it’s powertools like column selectors and nested data structures mirror the best of dplyr and tidyr’s expressive and concise syntax".
Modern Data Visualization with R
Another online book, by Robert Kabacoff.
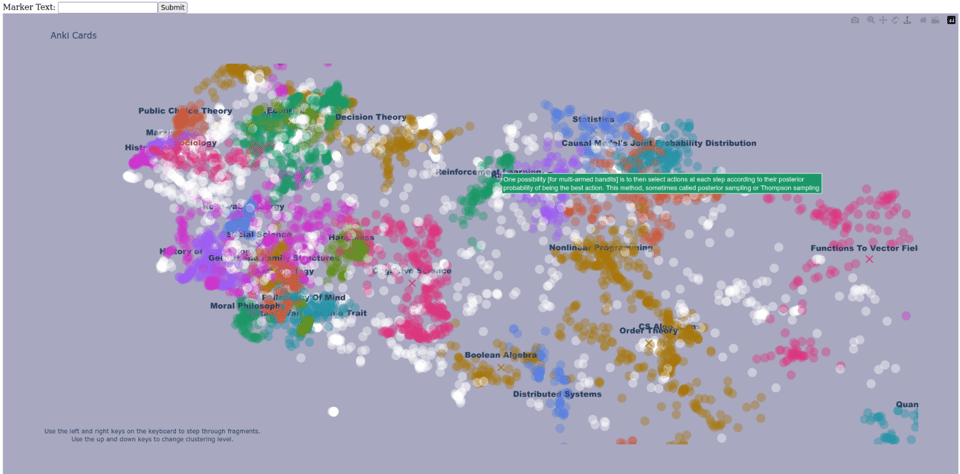
Visualize and compare embeddings for text sequences
"This is a small project for visualizing embeddings."
🤯 Data thinking
Avoiding Mistakes Via... Powerpoint (?!)
Quantitative UX researcher Randy Au: "*I'll go into how I work with data so that I wind up having less mistakes get through to the point where other people see them. It's not exactly revolutionary stuff, but maybe someone will find it useful."
My Thoughts Going Into a New Year
Quite a few good areas for further reflection in this article: "AI's (lack of) impact on data practitioners (so far). AI and content rights. OSS Licensing. dbt project hygiene. Where we're at with the MDS."
📈Dataviz, Data Analysis, & Interactive
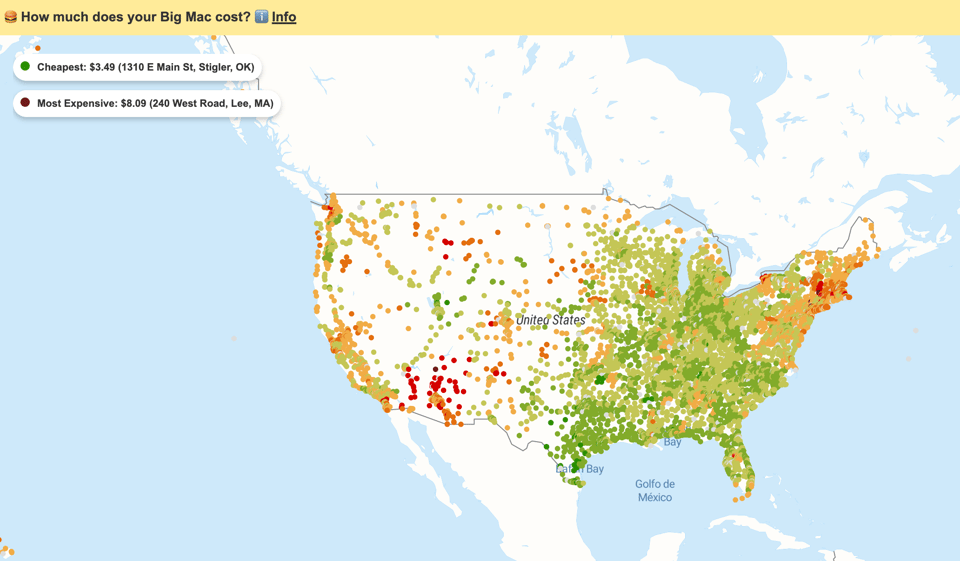
McCheapest
"This app tracks the price of Big Mac at every McDonald's location across the U.S." There's me learning something new – I knew about the Economist's Big Mac Index, but not that prices varied within one country (in this case, across the US).
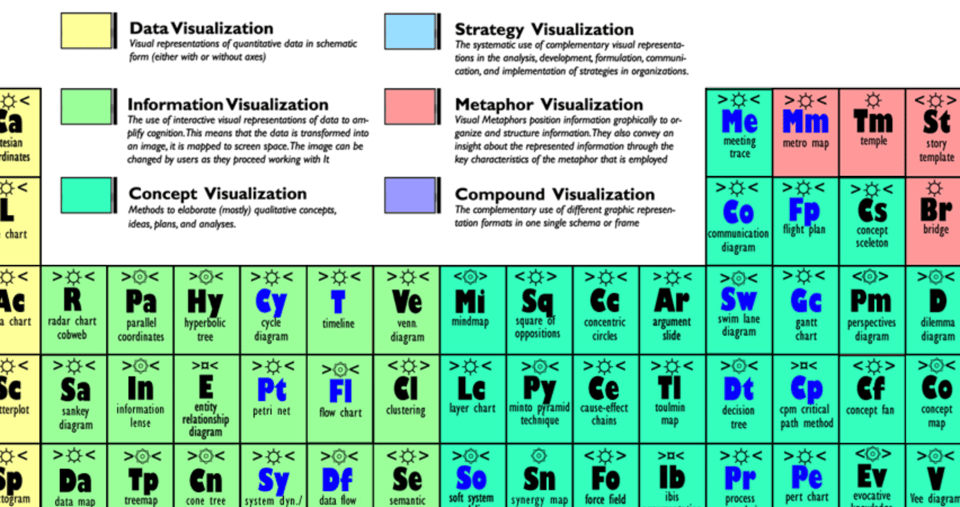
A periodic table of visualization methods
I've seen a few similar ones to this, but here's another for you – this is probably a bit more old-fashioned in scope.
FROM-TO
"Compare the city you know with the city you don't."
This seems to use some form of AI, and I'm definitely stretching it in the example below.

🤖 AI
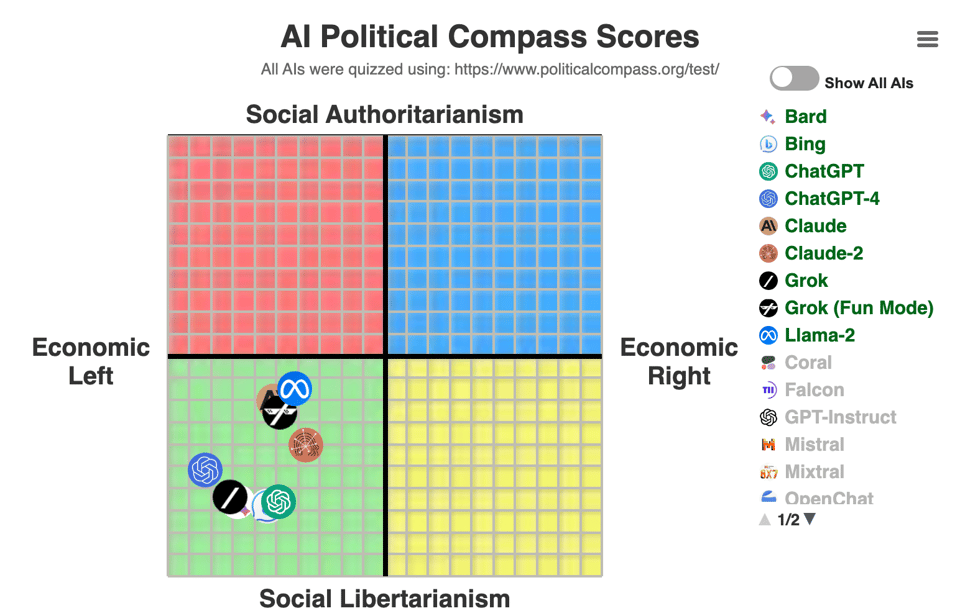
Tracking AI
A website "monitoring Bias in Artificial Intelligence Chatbots" asking every day a politically-charged question. This is neither unbiased nor proper peer-reviewed research, but it's nonetheless an interesting concept to keep an eye on.
quantum of sollazzo is also supported by Andy Redwood’s proofreading – if you need high-quality copy editing or proofreading, check out Proof Red. Oh, and he also makes motion graphics animations about climate change.

Supporters*
Alex Trouteaud
casperdcl
[*] this is for all $5+/months Github sponsors. If you are one of those and don't appear here, please e-mail me
