548: quantum of sollazzo
#548: quantum of sollazzo – 16 January 2024
The data newsletter by @puntofisso.

Hello, regular readers and welcome new ones :) This is Quantum of Sollazzo, the newsletter about all things data. I am Giuseppe Sollazzo, or @puntofisso. I've been sending this newsletter since 2012 to be a summary of all the articles with or about data that captured my attention over the previous week. The newsletter is and will always (well, for as long as I can keep going!) be free, but you're welcome to become a friend via the links below.
We have some great new sponsored content: Ed Freyfogle, organiser of location-based service meetup Geomob, co-host of the Geomob podcast, and co-founder of the OpenCage, has offered to introduce a set of points around the topic of geodata. His first entry starts a few paragraphs below on geocoding.
The European Data Journalism Centre is running its annual survey of the state of the industry: the State of Data Journalism 2023 survey will be closing in a week, is closing on Tuesday, 16 January 2024, at midnight – i.e. TONIGHT.
The survey takes approximately 10-15 minutes to complete. Most questions are optional. It is available in English, Spanish, and Italian.
The most clicked link last week was The TimeViz Browser of Visualization Techniques for Time-Oriented Data.
'till next week,
Giuseppe @puntofisso
|
Before you go... DO YOU LIKE QUANTUM OF SOLLAZZO? → BECOME A SUPPORTER! :) If you enjoy this newsletter, you can support it by becoming a GitHub Sponsor. Or you can Buy Me a Coffee. I'll send you an Open Data Rottweiler sticker. You're receiving this email because you subscribed to Quantum of Sollazzo, a weekly newsletter covering all things data, written by Giuseppe Sollazzo (@puntofisso). If you have a product or service to promote and want to support this newsletter, you can sponsor an issue. |
✨ Topical
Which groups have experienced an increase in hate crimes?
USAFacts: "Anti-transgender and anti-Jewish hate crimes increased 35% or more between 2021 and 2022."
The article uses data from the FBI's Crime Data Explorer.

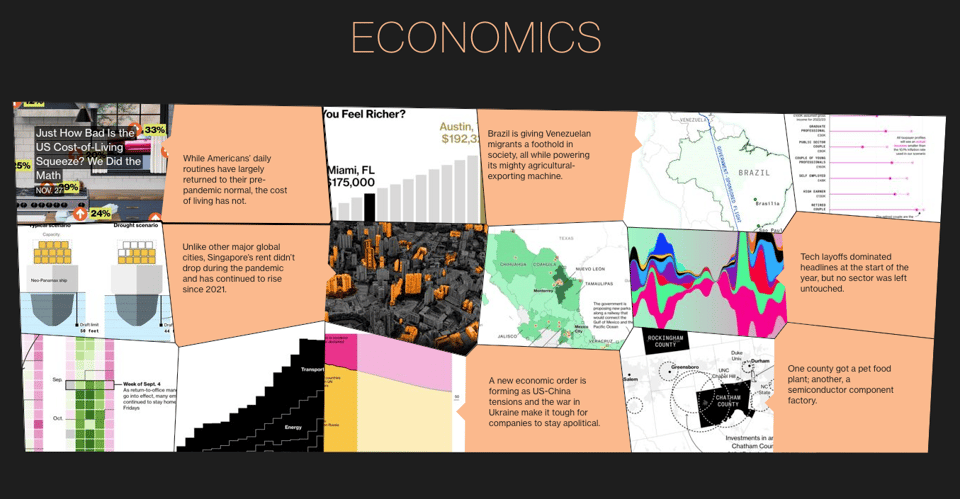
2023 – The year in graphics
Bloomberg Graphics produced a very good thematic view of the year through their charts. Look also at ABC.
Our data problems are getting harder to ignore
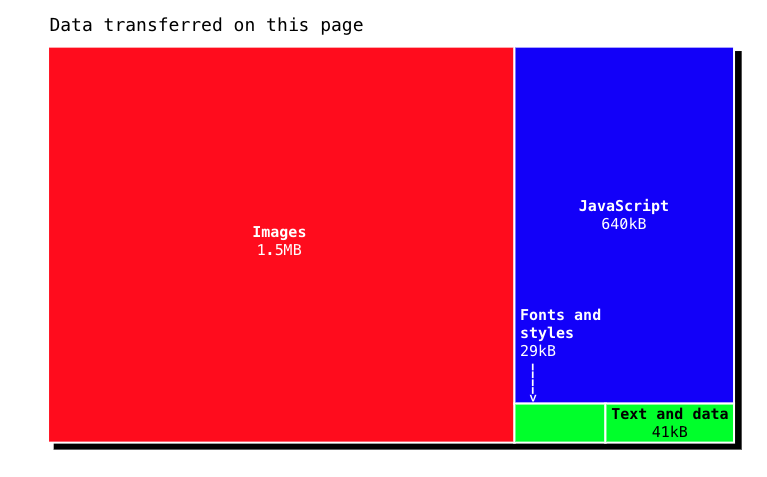
Don't be misled by the appearance of this page by The Straits Times when you first load it – it's part of the argument it's making.
"When you load a webpage, like this one, you see the result of the data you requested, but not the data centre where it came from or the energy it consumed. You can see when pages aren’t loading, but not the carbon emissions from your digital activity.
We investigate the environmental impact of our global data demand and what's being done to minimise it."
What is geocoding?
Geocoding is translating between geo coordinates (latitude, longitude) and human place descriptions (addresses, placenames, etc). There are two kinds of geocoding:
- Forward geocoding: address to coordinates
- Reverse geocoding: coordinates to address
More smart phones and tracking devices means more geodata is being created than ever before. Geocoding is a first step in processing that data into useful information. In the coming weeks this series will look at the challenges around geocoding.
At OpenCage we run a highly available, simple to use, worldwide, geocoding API based on open datasets like OpenStreetMap. Have a project that will need geocoding? See our geocoding buyer's guide for an overview of all the factors to consider when choosing between geocoding services.
🛠️📖 Tools & Tutorials
htmx playground
A good way to learn about htmx.

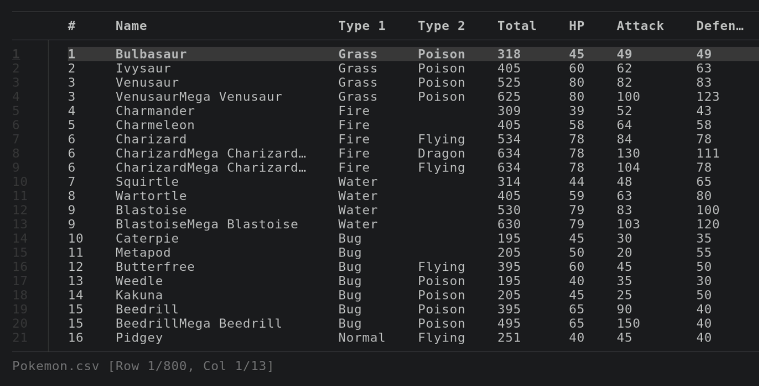
csvlens
"csvlens is a command line CSV file viewer. It is like less but made for CSV."
Fastest Way to Read Excel in Python
"Reading 500K rows in less than 4 seconds" – this blog post shows how to manipulate Excel spreadsheets in Python using Pandas, Tablib, Openpyxl, LibreOffice, DuckDB, and Calamine. It tests for speed, types, and correctness.

One billion row challenge using base R
Here's a report on the challenge of writing and R "*program for retrieving temperature measurement values from a text file and calculating the min, mean, and max temperature per weather station. There’s just one caveat: the file has 1,000,000,000 rows!"

Trelliscope
"Trelliscope is an R package (Python and JavaScript versions coming soon) that provides tools to interactively and flexibly visualize data in detail by producing many plots of subsets of your data — stored in a "data frame of visualizations" — and providing an interactive web application to explore them."
It's open source and it comes with a rich library of examples.

📈Dataviz, Data Analysis, & Interactive
Vibes in Verse: Decoding the band TEMMIS
Vivien Serve on producing this Datawrapper Weekly Chart: "It was only through making this chart that I realized TEMMIS has just nine songs — how could I not see that while streaming them on repeat? But their small catalog does make it easier to see the whole picture: TEMMIS lyrics tend use the melancholy words like Nacht (night) or vorbei (over) that are typical for the New New Wave genre. But the songs are very different in lyrical structure. Some use one distinctive word like Sommer (summer) or Klinge (blade) extensively, while others use only common words that appear in almost every song."

🤖 AI
Stuff we figured out about AI in 2023
Simon Willison: "2023 was the breakthrough year for Large Language Models (LLMs). I think it’s OK to call these AI—they’re the latest and (currently) most interesting development in the academic field of Artificial Intelligence that dates back to the 1950s. Here’s my attempt to round up the highlights in one place!"
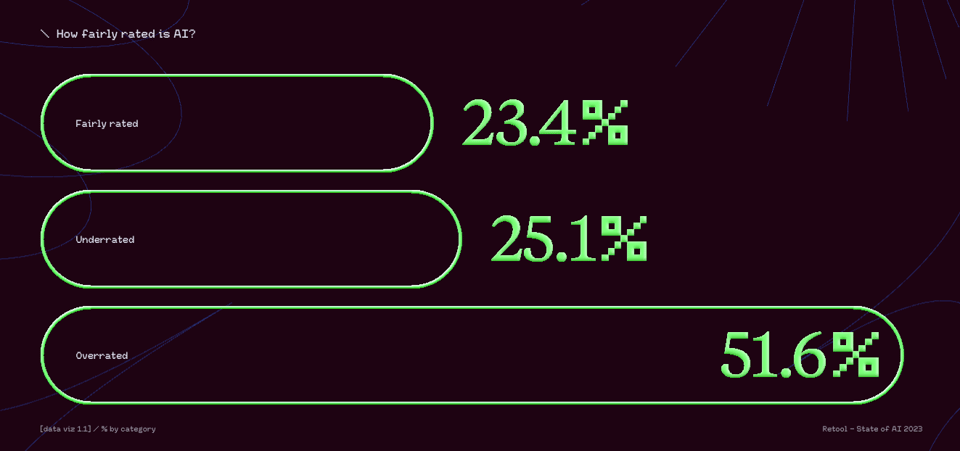
State of AI 2023
This one is by Retool.
quantum of sollazzo is also supported by Andy Redwood’s proofreading – if you need high-quality copy editing or proofreading, check out Proof Red. Oh, and he also makes motion graphics animations about climate change.

Supporters*
Alex Trouteaud
casperdcl
[*] this is for all $5+/months Github sponsors. If you are one of those and don't appear here, please e-mail me
