547: quantum of sollazzo
#547: quantum of sollazzo – 9 January 2024
The data newsletter by @puntofisso.

Hello, regular readers and welcome new ones :) This is Quantum of Sollazzo, the newsletter about all things data. I am Giuseppe Sollazzo, or @puntofisso.
I've been sending this newsletter since 2012 to be a summary of all the articles with or about data that captured my attention over the previous week. The newsletter is and will always (well, for as long as I can keep going!) be free, but you're welcome to become a friend via the links below.
The most clicked link last week was the intriguing 2nd City Zoning interactive map.
I'm having a few issues with the infrastructure behind this newsletter, which is triggering a lot of Spam filters. If you found this issue in the Spam box, could you please let me know?
On 31 January, I'll be one of the speakers on this live panel run by publisher UKAuthority on the intriguing topic of "Taking a human approach to public services data".
Please attend if you can, and feel free to reply to this and send me questions, ideas, and provocations, that you would like me to address during the session.
'till next week,
Giuseppe @puntofisso
|
Before you go... DO YOU LIKE QUANTUM OF SOLLAZZO? → BECOME A SUPPORTER! :) If you enjoy this newsletter, you can support it by becoming a GitHub Sponsor. Or you can Buy Me a Coffee. I'll send you an Open Data Rottweiler sticker. You're receiving this email because you subscribed to Quantum of Sollazzo, a weekly newsletter covering all things data, written by Giuseppe Sollazzo (@puntofisso). If you have a product or service to promote and want to support this newsletter, you can sponsor an issue. |
✨ Topical
Predictions for 2023, revisited
Rose Mintzer-Sweeney, Datawrapper: "Vox, the Financial Times, and the Economist all published lists of general news predictions for the coming year, covering topics like politics ("Will Erdoğan win the Turkish presidential election?"), climate ("Will the global temperature reach 1.5 degrees of warming?"), and economics ("Will the U.S. go into recession?"). Of all the "year ahead" pieces that come out each December, these stand out for taking clear stances on specific questions — Vox even included subjective probabilities for each judgment. That means we can see how they did, and they did pretty well!"

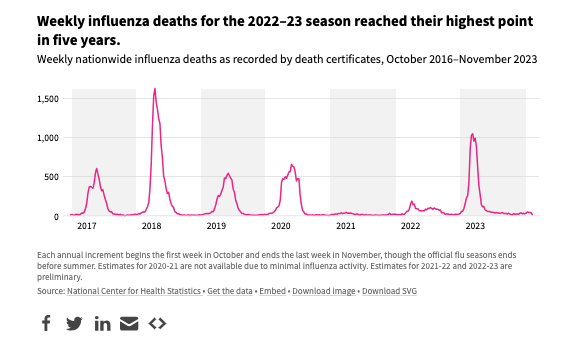
How many people get the flu?
USAFacts: "Flu cases have returned to pre-pandemic levels after two years of decline."
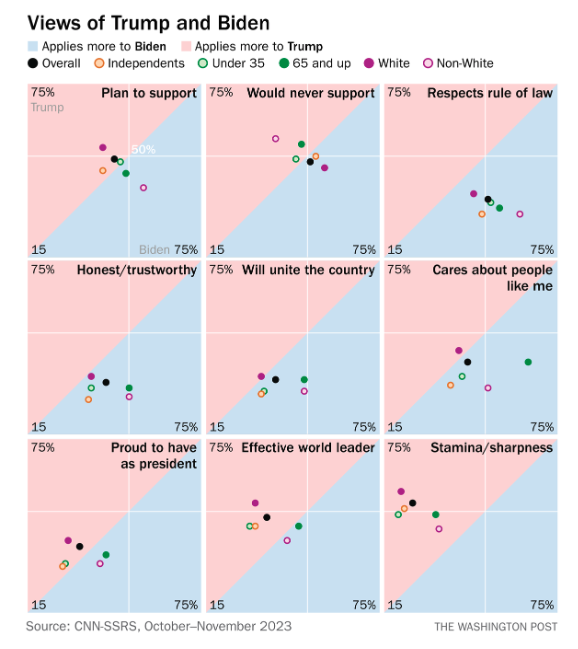
The best of "How To Read This Chart" 2023
The Washington Post's own sort of data newsletter has some good write-ups about 2023 charts.
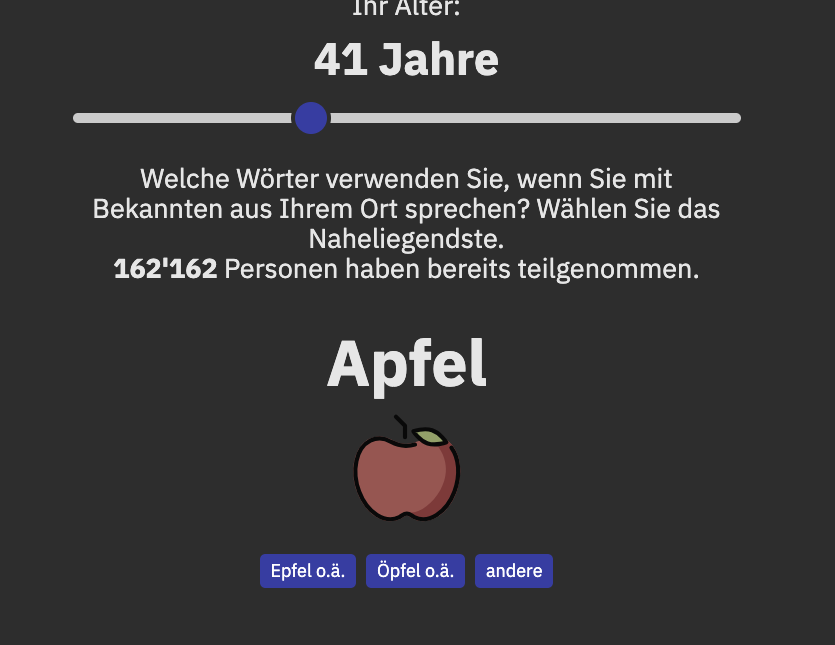
Unser Dialekt-Test weiss, woher Sie stammen
Half article, half self-test, this piece by the Swiss Tages Anzeiger gets where a reader is from by asking them which variants of Swiss German words they normally use.
Here is an automatically translated version, but you will want to play with the original one.
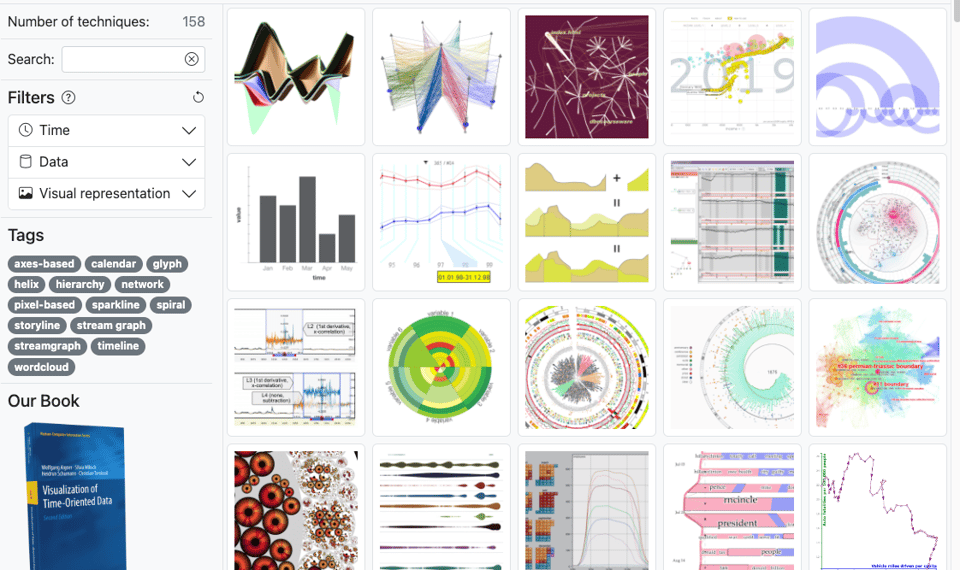
The TimeViz Browser 2.0
"A Visual Survey of Visualization Techniques for Time-Oriented Data."
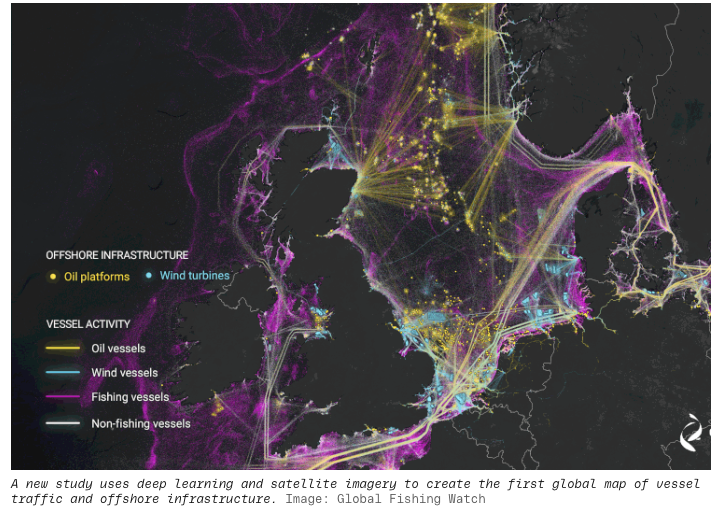
How crowded are the oceans? New maps show what flew under the radar until now
"Advances in AI and satellite imagery allowed researchers to create the clearest picture yet of human activity at sea, revealing clandestine fishing activity and a boom in offshore energy development."
(via Alex Wrottesley)
🛠️📖 Tools & Tutorials
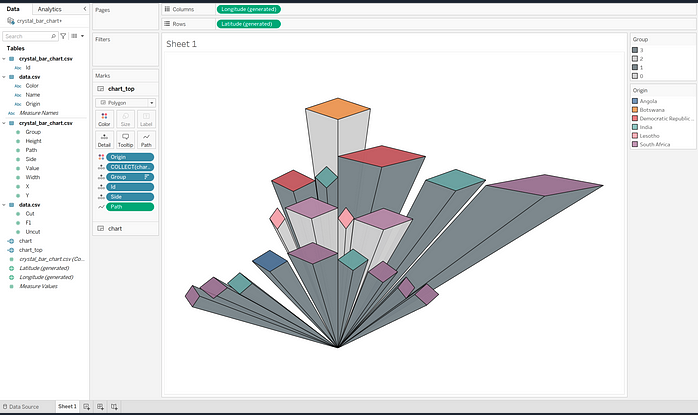
Introducing the Crystal Bar Chart: Visualizing Sequential Differential Clustering
"Learn about Crystal Bar Charts and create your own with Python."
Soccer Analytics 2023 Review
"Collection of the soccer analytics content that I liked the most in 2023", by Club Brugge's head of data and football (soccer?!) analytics guru Jan Van Haaren. A bit of everything including research and applied articles, and some code repositories.
HackerStartup
"Useful SaaS Kits & starter templates for developers to build your next project faster."
Not all are free.
Top Python libraries of 2023
There's a lot of AI in this list, but not only AI.
Good Tools. 100% free, hard-to-find, zero-cost digital tools that offer time and money savings to indie entrepreneurs.
🤯 Data thinking
📈Dataviz, Data Analysis, & Interactive
ORR Station Flow Images
Basically, a map of passenger flow for each and every station in Britain (as noted by Alasdair Rae, there are 2,657).
There is also a full source code repository for this, called kingfisher.
(via Peter Wood)

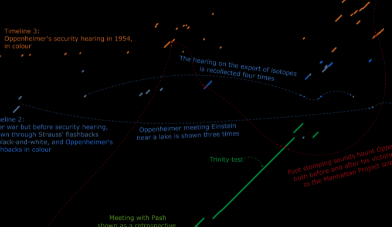
Oppenheimer movie timeline
"This feels more confusing than the movie", says a comment on this Reddit post. Here's a taster.
🤖 AI
Solving Reasoning Problems with LLMs in 2023
"*...this post will focus on the progress of LLM research on tool use and reasoning. We picked ~20 👀 mind-blowing 👀 papers and summarized their insights and implications."
quantum of sollazzo is also supported by Andy Redwood’s proofreading – if you need high-quality copy editing or proofreading, check out Proof Red. Oh, and he also makes motion graphics animations about climate change.

Supporters*
Alex Trouteaud
casperdcl
[*] this is for all $5+/months Github sponsors. If you are one of those and don't appear here, please e-mail me
