546: quantum of sollazzo
#546: quantum of sollazzo – 2 January 2024
The data newsletter by @puntofisso.

Hello, regular readers and welcome new ones :)
This is Quantum of Sollazzo, the newsletter about all things data. I am Giuseppe Sollazzo, or @puntofisso. I've been sending this newsletter since 2012 to be a summary of all the articles with or about data that captured my attention over the previous week. The newsletter is and will always (well, for as long as I can keep going!) be free, but you're welcome to become a friend via the links below.
Happy New Year! I hope your 2024 goes amazingly, and it is full of data love. This issue is shorter than usual due to the festive season. I'll be back in full swing next week.
'till next week,
Giuseppe @puntofisso
|
Before you go... DO YOU LIKE QUANTUM OF SOLLAZZO? → BECOME A SUPPORTER! :) If you enjoy this newsletter, you can support it by becoming a GitHub Sponsor. Or you can Buy Me a Coffee. I'll send you an Open Data Rottweiler sticker. You're receiving this email because you subscribed to Quantum of Sollazzo, a weekly newsletter covering all things data, written by Giuseppe Sollazzo (@puntofisso). If you have a product or service to promote and want to support this newsletter, you can sponsor an issue. |
✨ Topical
Down Underground
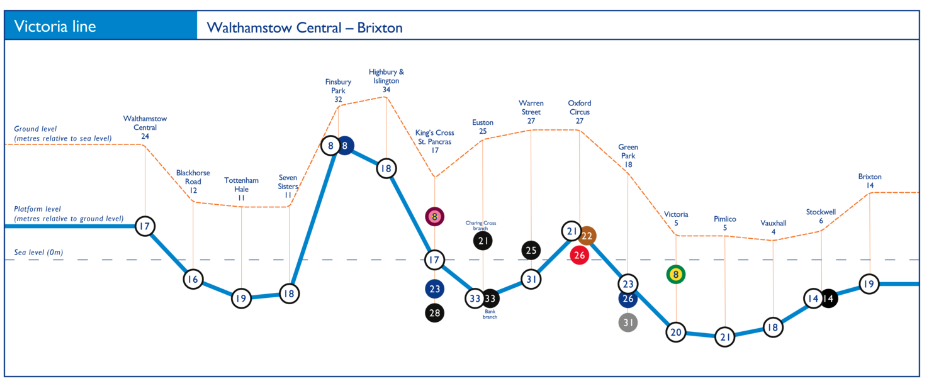
Designer Daniel Silva has created a series of London Underground maps that use their depth. A full PDF is available on the website and features maps like this one below.
I love that it captures both ground level and effective depth – Hampstead tube, for example, feels rather deep when you descend with the lift, but it is in fact way above sea level and buried within one of London's highest hills.
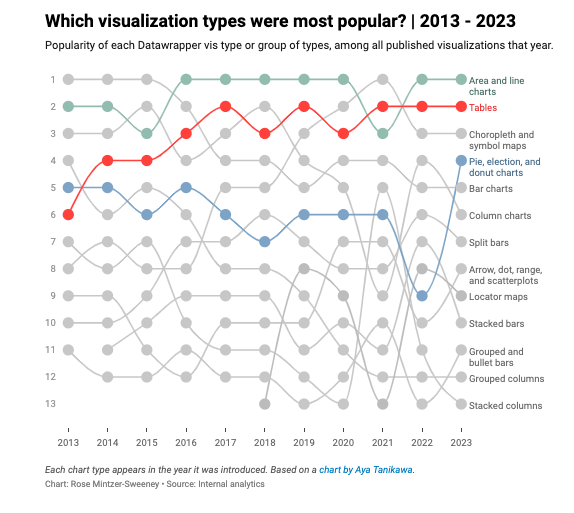
Which chart types did our users create in 2023?
Datawrapper's end of year review by Rose Mintzer-Sweeney.
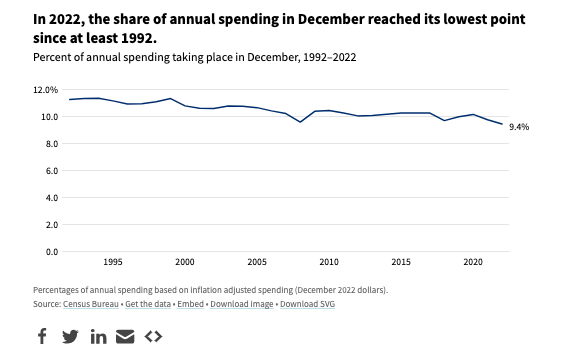
How much money do Americans spend on holiday shopping?
"Americans spent 20% more on retail purchases in December 2022 than they did in December 2012."
🛠️📖 Tools & Tutorials
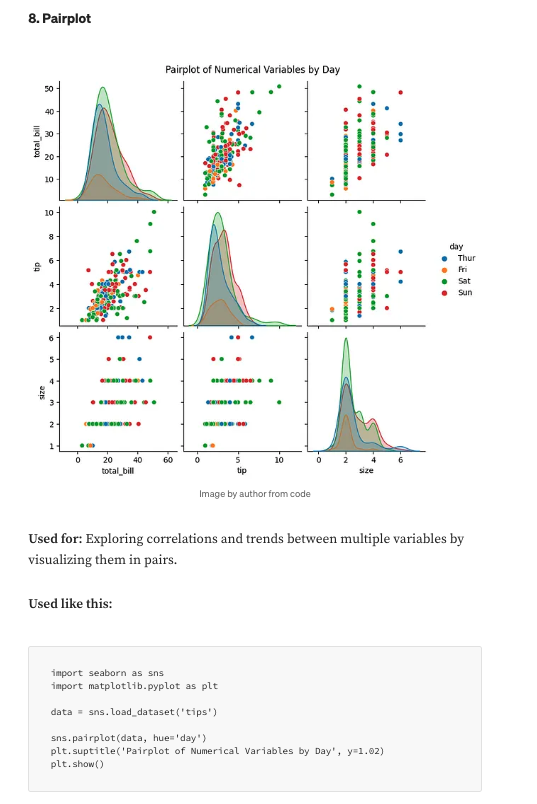
20% of EDA Plots Data Scientists Use 80% of the Time
"All the plots you need to know for EDA".
Pretty sure you know it, but EDA stands for Exploratory Data Analysis.
📈Dataviz, Data Analysis, & Interactive
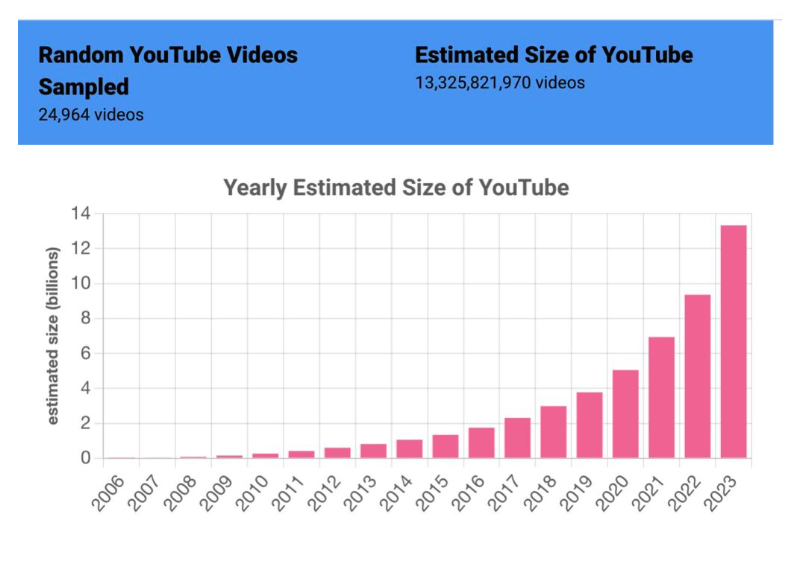
How Big is YouTube?
"*I got interested in this question a few years ago, when I started writing about the “denominator problem”. A great deal of social media research focuses on finding unwanted behavior – mis/disinformation, hate speech – on platforms. This isn’t that hard to do: search for “white genocide” or “ivermectin” and count the results. Indeed, a lot of eye-catching research does just this – consider Avaaz’s August 2020 report about COVID misinformation. It reports 3.8 billion views of COVID misinfo in a year, which is a very big number. But it’s a numerator without a denominator – Facebook generates dozens or hundreds of views a day for each of its 3 billion users – 3.8 billion views is actually a very small number, contextualized with a denominator."
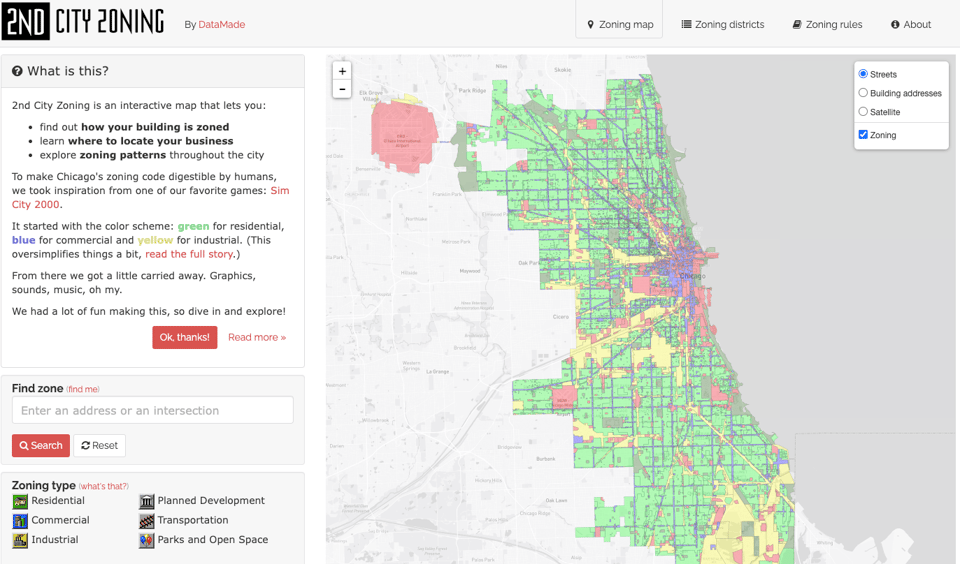
2nd City Zoning
Oh, this is pretty awesome: "2nd City Zoning is an interactive map that lets you find out how your building is zoned, learn where to locate your business, explore zoning patterns throughout the city. To make Chicago's zoning code digestible by humans, we took inspiration from one of our favorite games: Sim City 2000."
🤖 AI
Classifying Source Code using LLMs — What and How
"Sharing our experience at making LLM-based Source Code classifier".
quantum of sollazzo is also supported by Andy Redwood’s proofreading – if you need high-quality copy editing or proofreading, check out Proof Red. Oh, and he also makes motion graphics animations about climate change.

Supporters*
Alex Trouteaud
casperdcl / iterative.ai
[*] this is for all $5+/months Github sponsors. If you are one of those and don't appear here, please e-mail me