544: quantum of sollazzo
#544: quantum of sollazzo – 19 December 2023
The data newsletter by @puntofisso.

Hello, regular readers and welcome new ones :) This is Quantum of Sollazzo, the newsletter about all things data. I am Giuseppe Sollazzo, or @puntofisso. I've been sending this newsletter since 2012 to be a summary of all the articles with or about data that captured my attention over the previous week. The newsletter is and will always (well, for as long as I can keep going!) be free, but you're welcome to become a friend via the links below.
I had my little surgery last week and it all went well. I woke up from the general anaesthesia feeling rather well and... hungry. I had some time to recover and rest, and think about my first 3 months in the new job (yes, sorry, I'm sharing a LinkedIn post...).
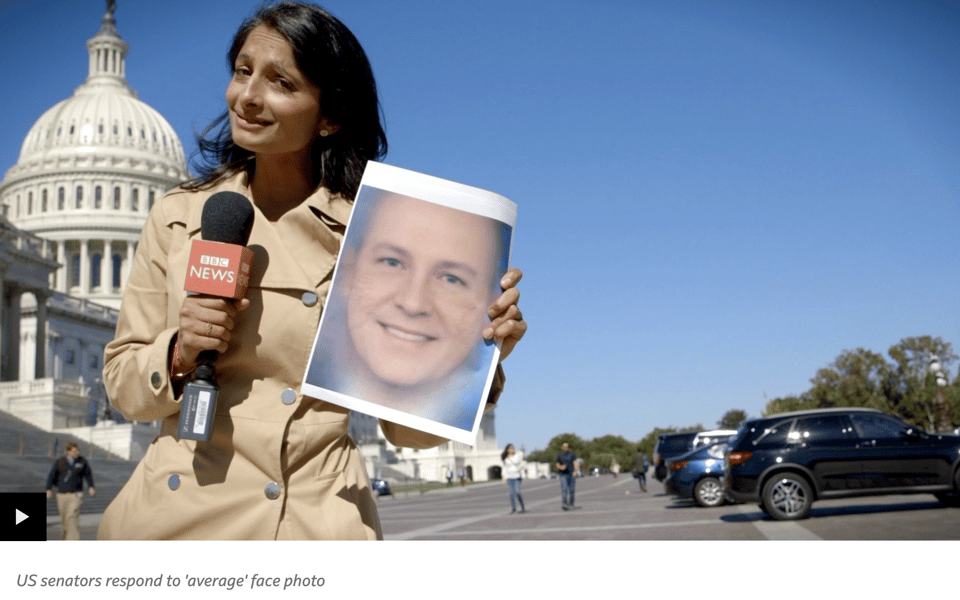
You might remember that a few years back, I did a little piece of work that went viral on the average face of the British Parliament. This was followed by a collaboration with the BBC, doing the same for the US Congress (including sending a journalist with a print-out to the Senate, interviewing startled senators), and for VoucherCodes on the faces of fashion (by averaging Vogue covers by country).
These projects, based on a brilliant tutorial by LearnOpenCV, got endless coverage on several media outlets and a MIT Press book by Jessica Helfand, and inspired similar uses elsewhere in the world, including a collaboration with James Morley on the poignant topic of the average First World War soldier (using the Imperial War Museum's Bond of Sacrifice collection).
As the code was showing signs of ageing and was no longer working on my server, I finally found the time to port it to OpenCV 3 and made it available via Colab and my blog
You might be interested in speaking at or attending Unwrapped, DataWrapper's Conference. It's fully virtual and on March 14 and 15.
The most clicked link last week was the Associated Press' look at the problem of agriculture in a world that is growing in population while being challenged by climate change.
'till next week,
Giuseppe @puntofisso
|
Before you go... DO YOU LIKE QUANTUM OF SOLLAZZO? → BECOME A SUPPORTER! :) If you enjoy this newsletter, you can support it by becoming a GitHub Sponsor. Or you can Buy Me a Coffee. I'll send you an Open Data Rottweiler sticker. You're receiving this email because you subscribed to Quantum of Sollazzo, a weekly newsletter covering all things data, written by Giuseppe Sollazzo (@puntofisso). If you have a product or service to promote and want to support this newsletter, you can sponsor an issue. |
✨ Topical
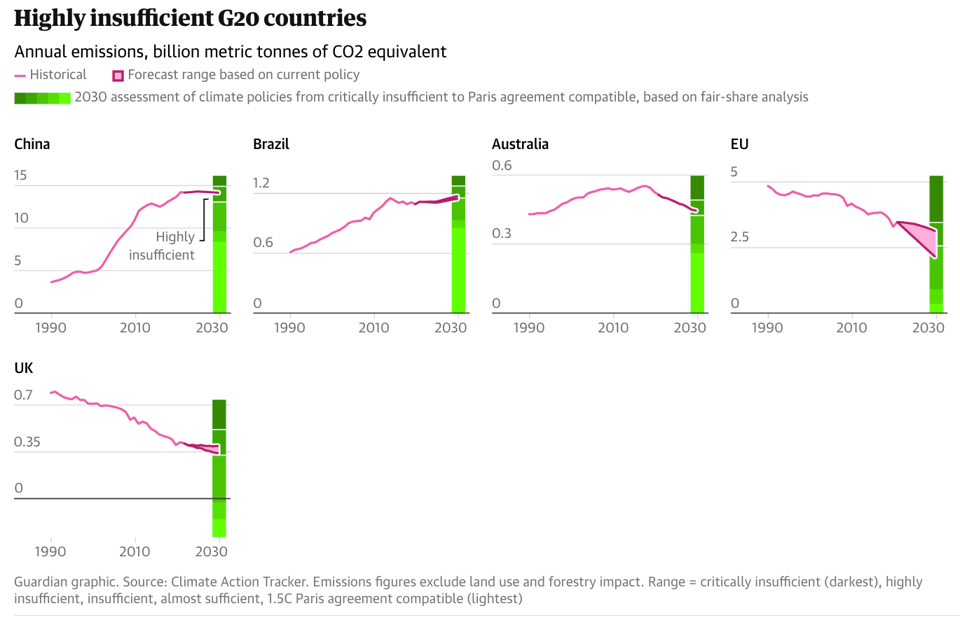
Visualised: how all of G20 is missing climate goals — but some nations are closer than others
Ashley Kirk: "As world leaders gather at Cop28, these charts show how far away the major economies are from their targets."
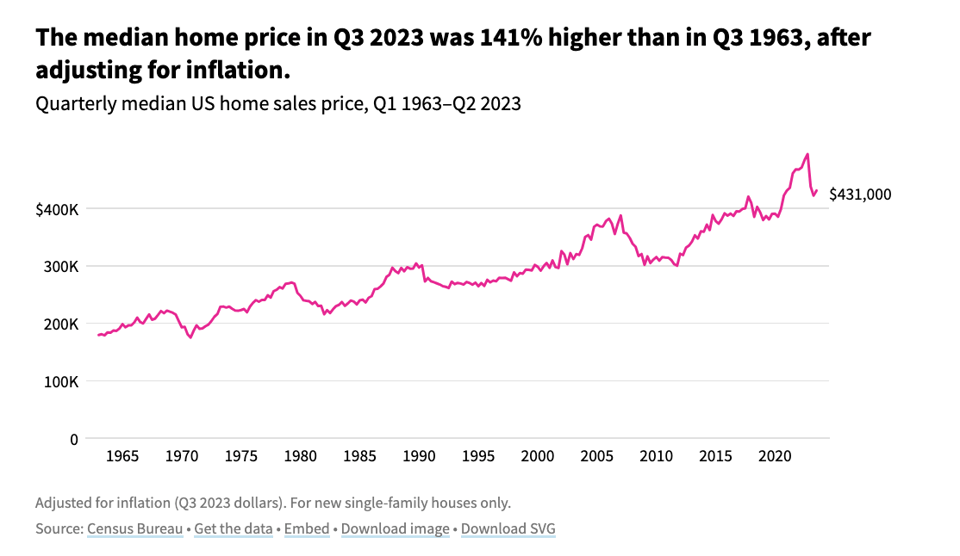
Where are home prices rising and falling in the US?
USAFacts: "Camden, New Jersey, saw a 10.6% increase in home prices this past year, the biggest nationwide increase. El Paso, Texas (10.3%), and Syracuse, New York (9.6%), followed."
I guess Camden, London, is not that different...
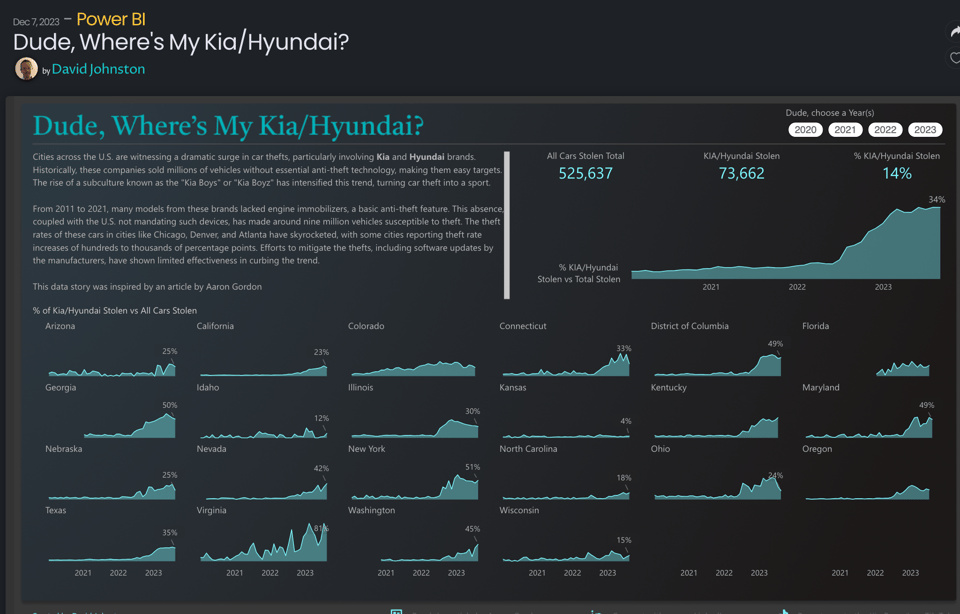
Dude, Where's My Kia/Hyundai?
A look at car theft in the US.
(via Jeremy Singer-Vine's newsletter)
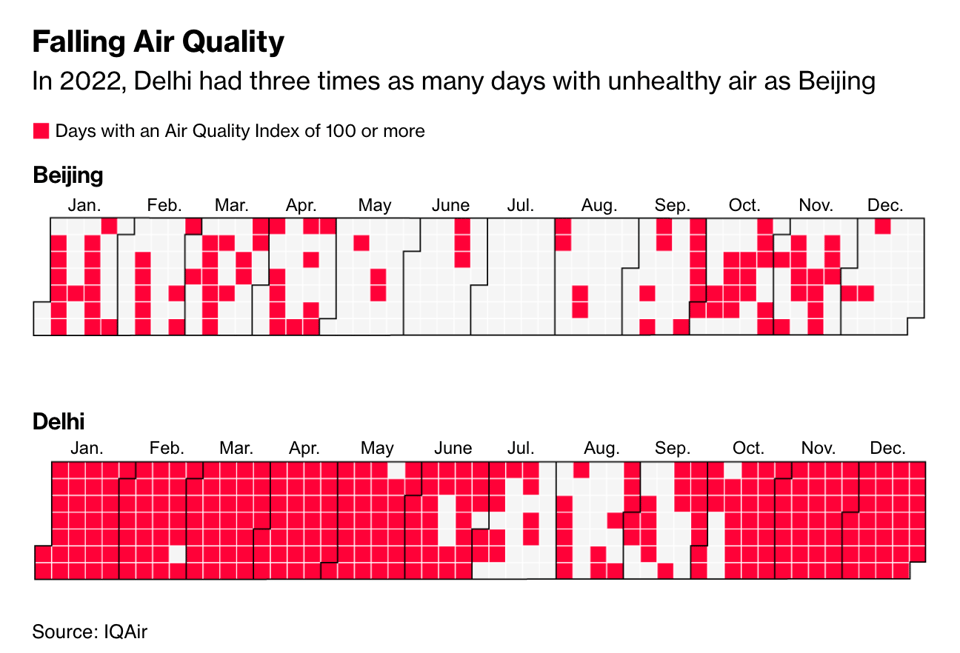
How China Cleaned Its Filthy Air While India Continues to Choke
A few interesting charts in this analysis by Bloomberg.
Etse-Ada: all in one suite of customisable web tools and support for managing your business operations - including websites, professional emails and an ERP consisting of CRM, accounting, project management, service/product management, and many more features. Learn more & Start a free trial.
🛠️📖 Tools & Tutorials
Tips to Guide Investigative Journalists in Document Text Analysis
Patrick Egwu talks to journalist/data analyst Fer Aguirre on how to approach text analysis. Video and write-up both interesting.
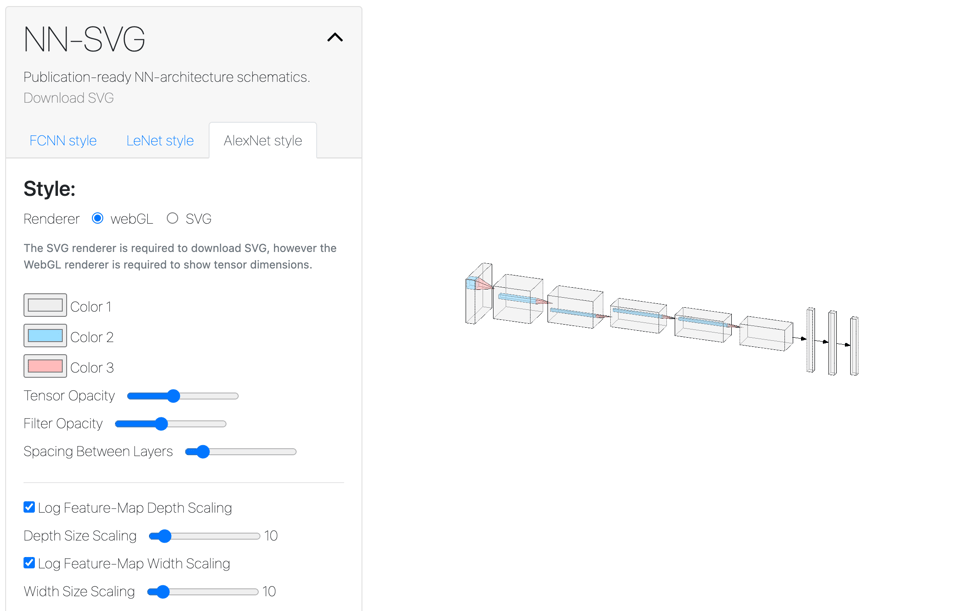
NN-SVG
"Publication-ready NN-architecture schematics" with an available download directly in SVG format.
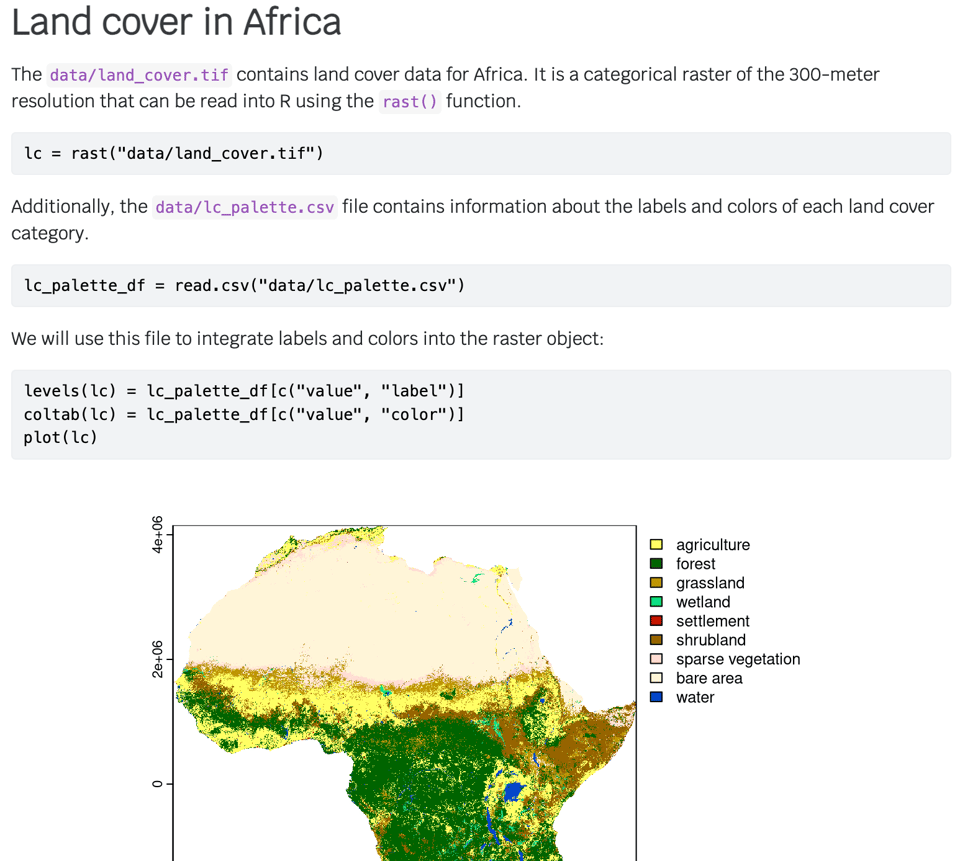
Finding the most unique land cover spatial pattern
"Spatial signatures represent spatial patterns of land cover in a given area. Thus, they can be used to search for areas with similar spatial patterns to a query region or to quantify changes in spatial patterns. The approaches above are implemented as lsp_search() and lsp_compare() functions of the motif R package, respectively.
At the same time, it is possible to create other, more customized workflows. Here, I will show how to compare spatial patterns of two different areas and find the most unique land cover spatial pattern in the process."
The hidden depths of the input element
"Most elements behave the same way regardless of their attributes, the type attribute of the \<input> element can take 1 of 22 different values that gives it not only different behaviour, but a different visual appearance too (many of which are hell to style, of course)."
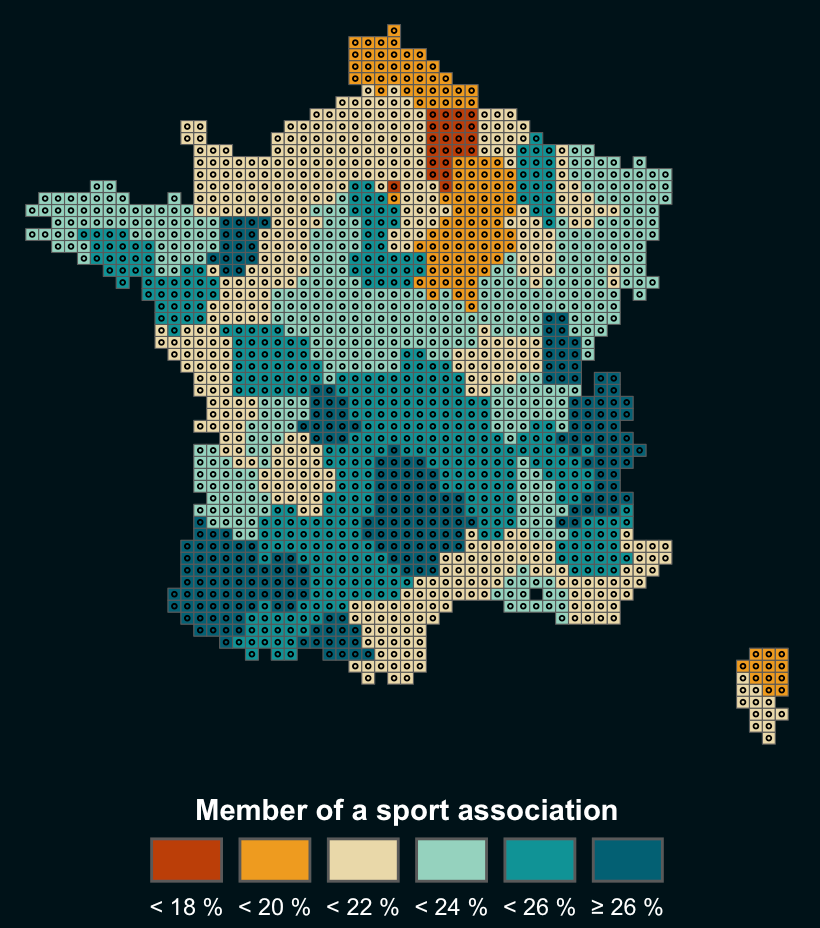
Lego Choropleth map with R
"This blogpost explains how to build a lego choropleth map to check the proportion of people doing sport on the French territory. The lego style is implemented in R using the ggplot2 and sf packages. This article includes a step-by-step walkthrough of the map construction, together with its final reproducible code."
LOOM
"Line Ordering Optimized Maps".
To be entirely honest, I don't fully understand the premise. But, hey, it's about transit maps :-)
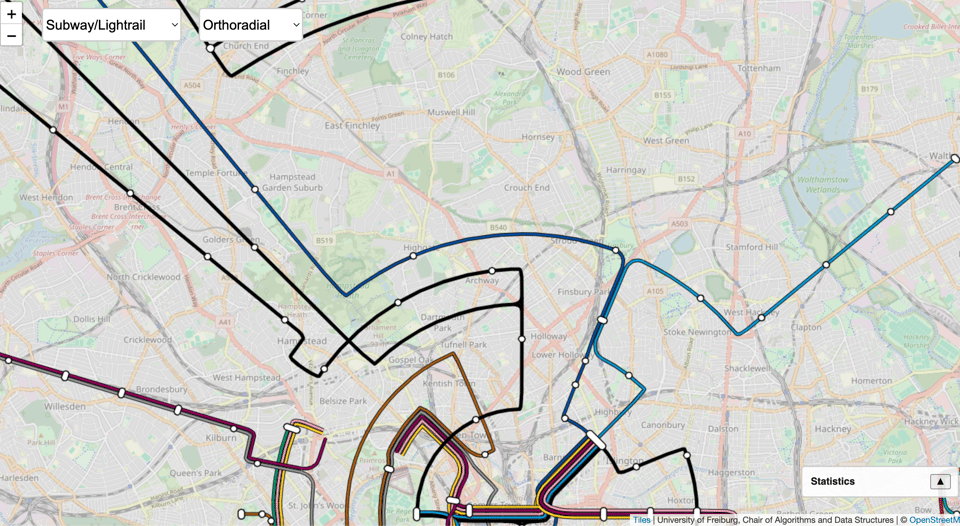
HTML5 Boilerplate v9.0.0 Released
This is a very popular boilerplate, which hadn't seen an update for some time.
UserStock
"Free photos of people's faces to use as avatars in UI mockups, prototypes and more."

Creating Christmas Cards with R
"The programming language R is capable of creating a wide variety of geometric shapes that can be used to construct high quality graphics – including festive images. In this tutorial, Nicola Rennie walks us through the process of using R packages to create and send Christmas cards with R."

🤯 Data thinking
More on autocorrelation and Dunning-Kruger...
Following on from last issue's link to Dunning-Kruger as a form of autocorrelation, Ghent-based Prof Daniele Marinazzo sent me these two intriguing papers from his research team. Being research papers, they are not immediately easy for the non-academics to read, but they look at intriguing questions around the link between correlation and causation. Here they are:
- Disentangling high-order mechanisms and high-order behaviours in complex systems
- Advancing functional connectivity research from association to causation.
Psyc 6135: Psychology of Data Visualization
Materials from a 2022 course by psychologist Michael Friendly (York University, Canada).
📈Dataviz, Data Analysis, & Interactive
UK Address Oddities!
"A few of my previous blog posts have been about quirks in the UK postal address system. As a result of these posts being moderately popular, people have contacted me to tell me about other such quirks."
A few curiosities including very high house numbers, fractions, and – my absolute favourite – negative numbers.
(via Leonardo Macchia)
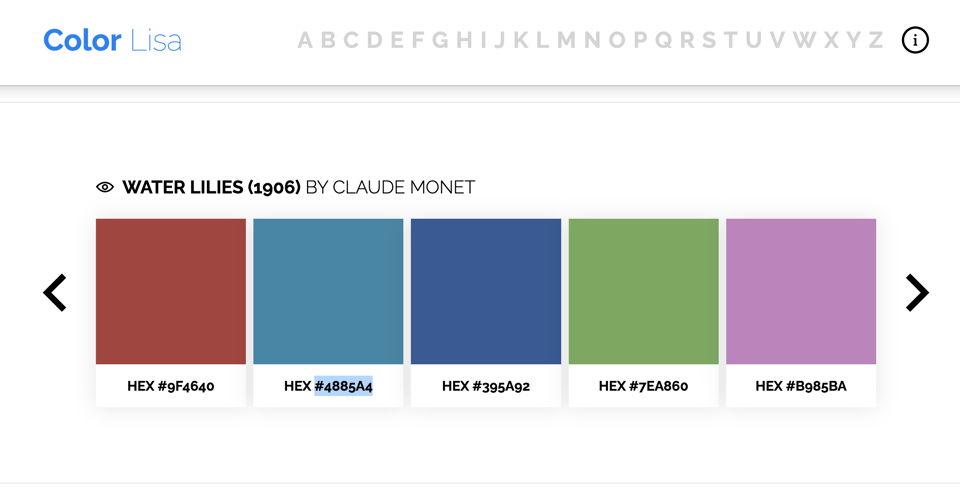
ColorLisa
"Color palette masterpieces from the world's greatest artists."
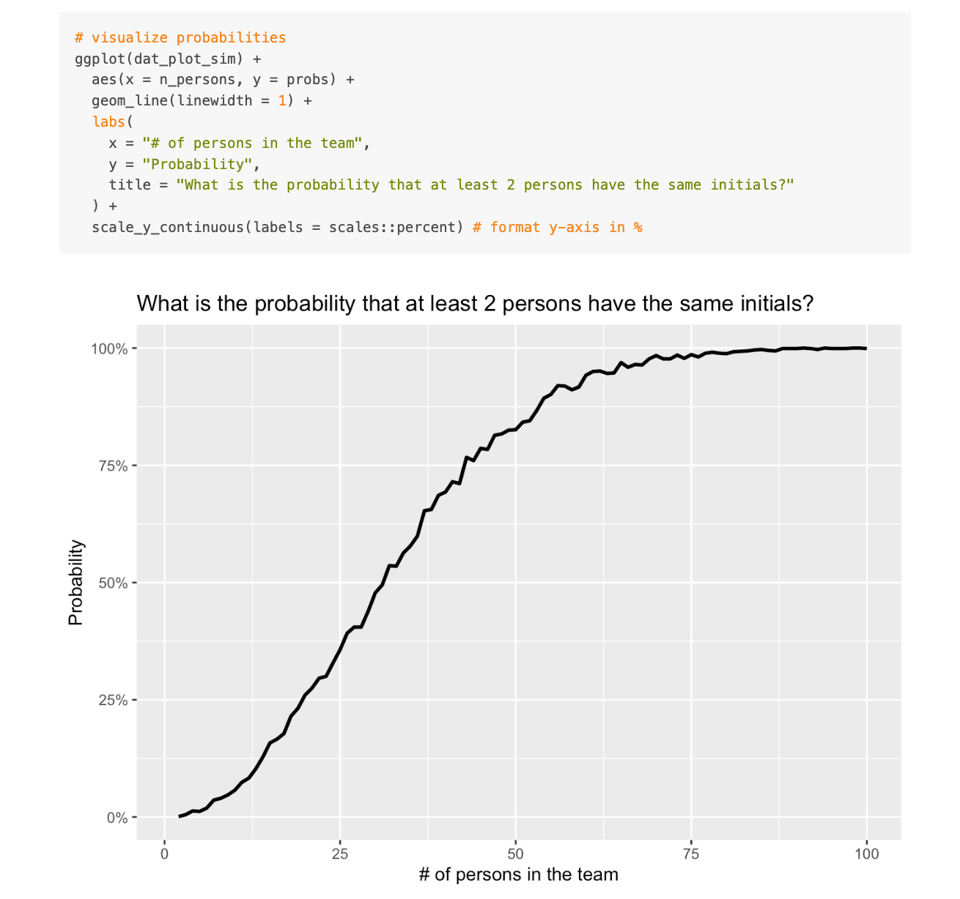
What is the probability that two persons have the same initials?
A variation of the birthday "paradox".
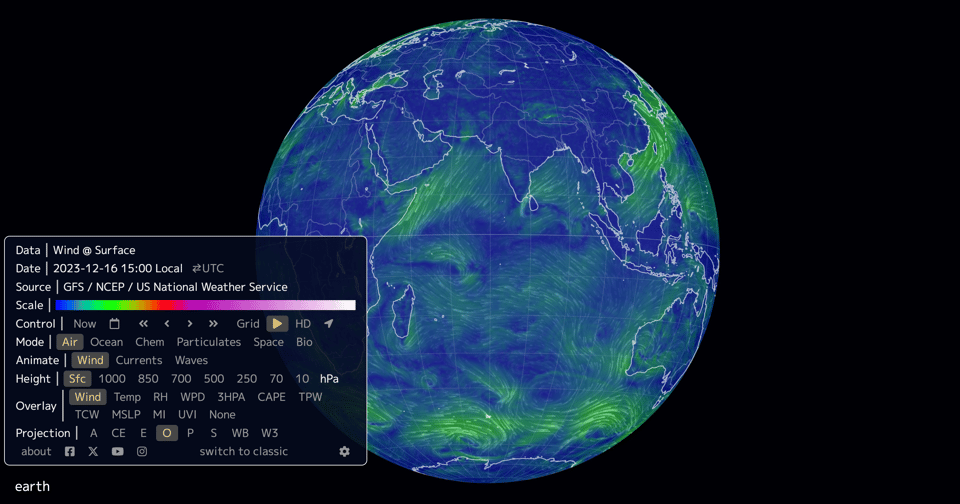
Wind @ Surface
A beautiful map of winds.
🤖 AI
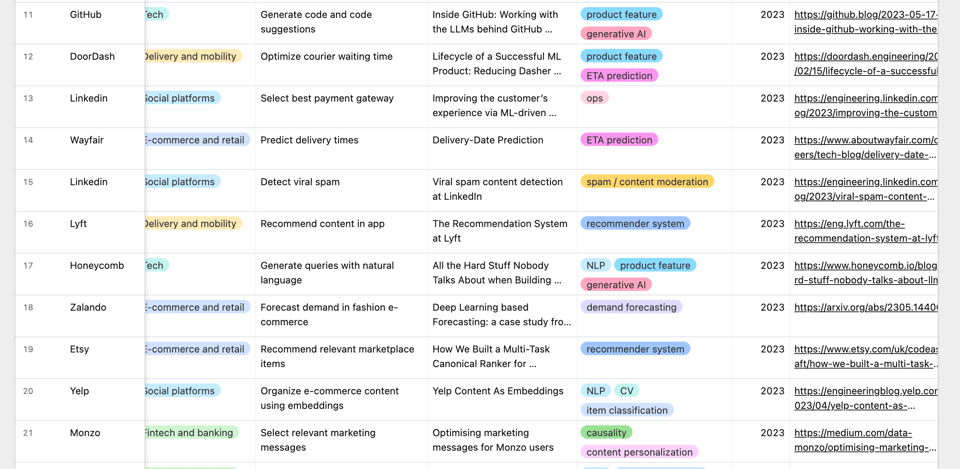
ML system design: 300 case studies to learn from
"How do companies like Netflix, Airbnb, and Doordash apply machine learning to improve their products and processes? We put together a database of 300 case studies from 80+ companies that share practical ML use cases and learnings from designing ML systems."
AI and Trust
A rather political blog post by IT security expert Bruce Schneier, who calls for regulation, His point is, of course, being hotly debated and a consensus answer hasn't yet formed; but the article gives some interesting reflection on our relationship to and expectations of technology.
quantum of sollazzo is also supported by Andy Redwood’s proofreading – if you need high-quality copy editing or proofreading, check out Proof Red. Oh, and he also makes motion graphics animations about climate change.

Supporters*
Alex Trouteaud
casperdcl / iterative.ai
Naomi Penfold
[*] this is for all $5+/months Github sponsors. If you are one of those and don't appear here, please e-mail me
