541: quantum of sollazzo
#541: quantum of sollazzo – 14 November 2023
The data newsletter by @puntofisso.

Hello, regular readers and welcome new ones :) This is Quantum of Sollazzo, the newsletter about all things data. I am Giuseppe Sollazzo, or @puntofisso. I've been sending this newsletter since 2012 to be a summary of all the articles with or about data that captured my attention over the previous week. The newsletter is and will always (well, for as long as I can keep going!) be free, but you're welcome to become a friend via the links below.
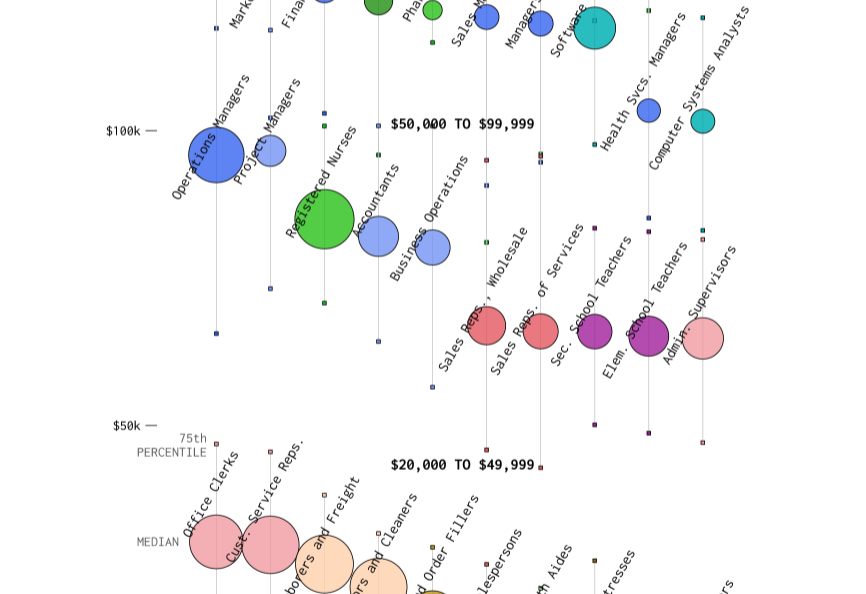
The most clicked link last week was FlowingData's analysis of income percentiles in the Us.
'till next week,
Giuseppe @puntofisso
|
Before you go... DO YOU LIKE QUANTUM OF SOLLAZZO? → BECOME A SUPPORTER! :) If you enjoy this newsletter, you can support it by becoming a GitHub Sponsor. Or you can Buy Me a Coffee. I'll send you an Open Data Rottweiler sticker. You're receiving this email because you subscribed to Quantum of Sollazzo, a weekly newsletter covering all things data, written by Giuseppe Sollazzo (@puntofisso). If you have a product or service to promote and want to support this newsletter, you can sponsor an issue. |
✨ Topical
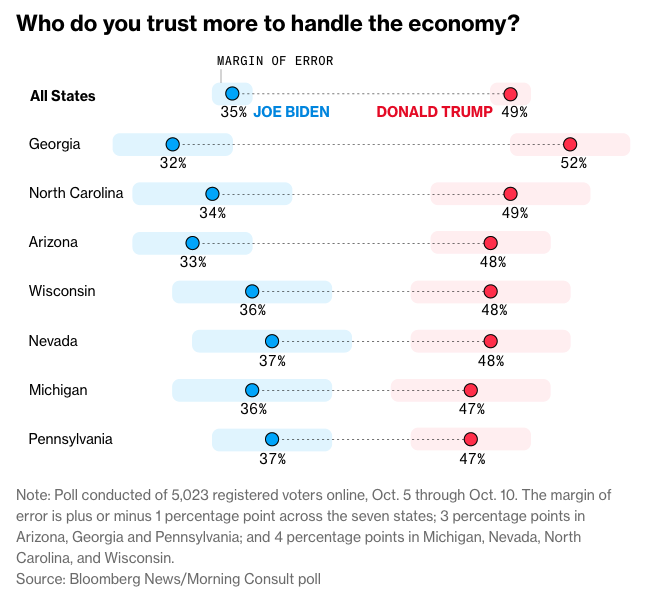
How 2024 Swing-State Voters Feel About the US Economy — In 10 Charts
"Here’s what voters in Arizona, Georgia, Michigan, Nevada, North Carolina, Pennsylvania and Wisconsin had to say about the US economy."
Protected areas are highly vulnerable to fire
The European Data Journalism Network together with OpenPolis: "Fires destroy ecosystems, and the harm is multiplied when protected areas are involved. More than a quarter of all Natura 2000 sites burned in 2021 were located in Italy."

TomTom Traffic Index
"Take a look at the trends around EV usage. Scan through the numbers for emissions. Find out the city rankings for travel time. Our data takes you across cities, countries and continents. "
(via Paul Ash)

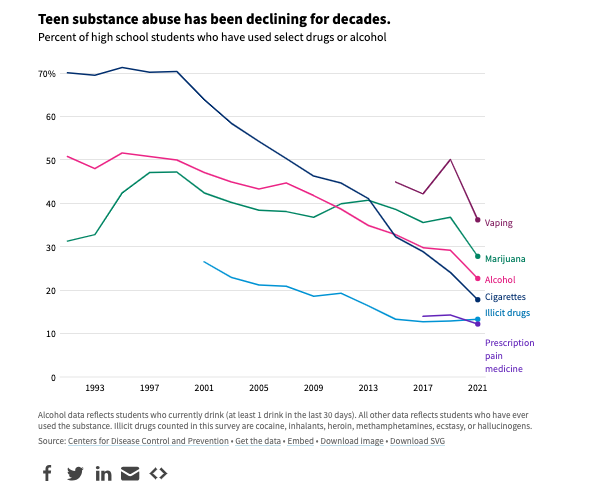
Is teen drug and alcohol use declining?
USA Facts (so this is US-only): "Teen substance use generally declined from 2011 to 2021. However, some substances are gaining in popularity."

Etse-Ada: all in one suite of customisable web tools and support for managing your business operations - including websites, professional emails and an ERP consisting of CRM, accounting, project management, service/product management, and many more features. Learn more & Start a free trial.
🛠️📖 Tools & Tutorials
cluestar
"This library contains visualisation tools that might help you get started with classification tasks. The idea is that if you can inspect clusters easily, you might gain a clue on what good labels for your dataset might be!"
How could I not link to a library named with such a pun.

Buttons.cool
A collection of free buttons.

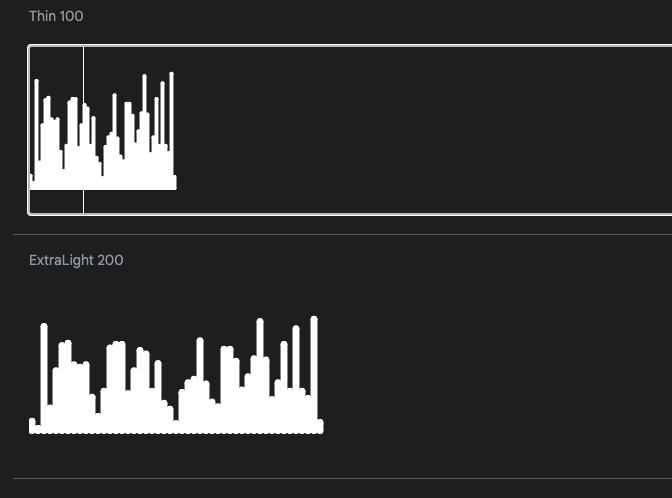
Wavefont
A font for the creation of bar charts.
📈Dataviz, Data Analysis, & Interactive
The Furthest Object Visible From The Shard
"When standing at the top of the Shard, I wanted to know what is the furthest object visible from this height in central London. The first photo below shows what I believe was the furthest object."
With LIDAR data, I'm sure someone could try and automate this... (me? I wish I had enough time!)
The Unofficial NYC Subway Rat Census
Ivan Lokhov (Datawrapper): "After recently stumbling upon a dataset of rat sightings in the New York subway system, I decided to continue our unofficial series on rodent life in the Big Apple."
The beauty of Datawrapper is that it makes beautiful dataviz even for something as funny as rat counting, and it makes it effortlessly.

Surprising visual insights from US election campaign data
Corey Lanum (Cambridge Intelligence): "Wherever you are on the political spectrum, most of us assume financial backers stay loyal to their chosen candidate or party in the run up to an election. I thought so too, until I started to investigate America’s latest election campaign data."

The Poet’s Journey: Visualizing Dante’s Divine Comedy Characters
"Exploring Literature Through Data Visualization". Information designer Michela Lazzaroni shares her visual journey through Dante Alighieri's masterpiece.

Most common jobs by income group
Another brilliant chart by FlowingData.
quantum of sollazzo is also supported by Andy Redwood’s proofreading – if you need high-quality copy editing or proofreading, check out Proof Red. Oh, and he also makes motion graphics animations about climate change.

Supporters*
Alex Trouteaud
casperdcl / iterative.ai
Naomi Penfold
[*] this is for all $5+/months Github sponsors. If you are one of those and don't appear here, please e-mail me