539: quantum of sollazzo
#539: quantum of sollazzo – 31 October 2023
The data newsletter by @puntofisso.

Hello, regular readers and welcome new ones :) This is Quantum of Sollazzo, the newsletter about all things data. I am Giuseppe Sollazzo, or @puntofisso. I've been sending this newsletter since 2012 to be a summary of all the articles with or about data that captured my attention over the previous week. The newsletter is and will always (well, for as long as I can keep going!) be free, but you're welcome to become a friend via the links below.
This made me laugh.
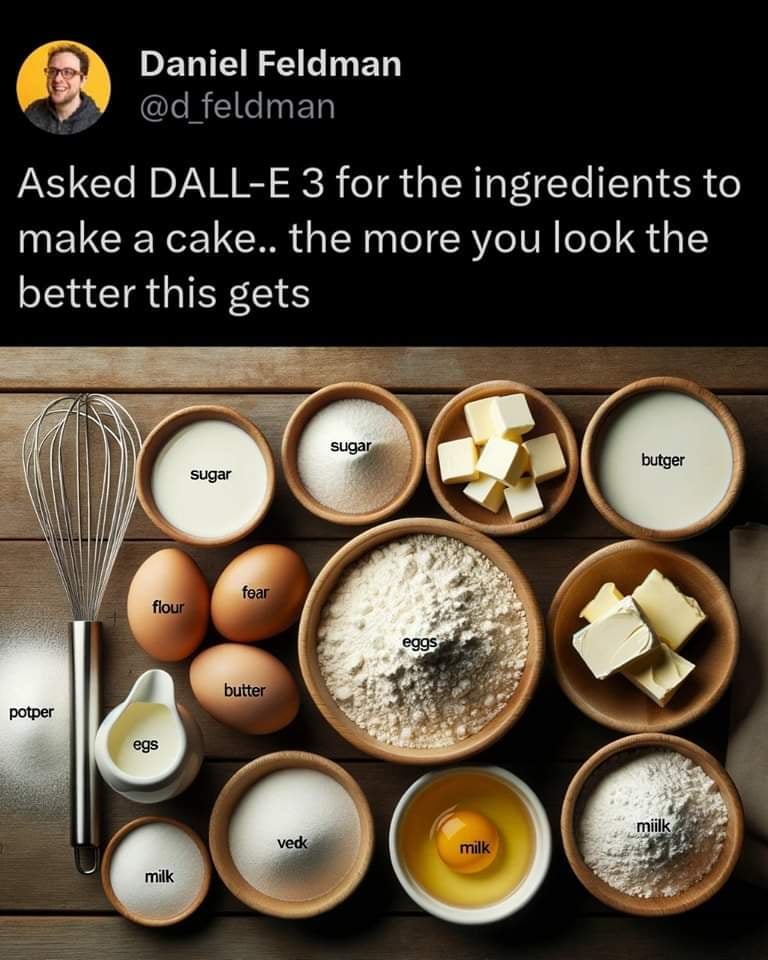
This was instead very flattering :) Quantum was mentioned in "The Plot", one of my favourite newsletters.

Topi Tjukanov has launched the 2023 version of his yearly #30DayMapChallenge. More details here. You'll probably see some of my selections of the best in the next few issues.

'till next week,
Giuseppe @puntofisso
|
Before you go... DO YOU LIKE QUANTUM OF SOLLAZZO? → BECOME A SUPPORTER! :) If you enjoy this newsletter, you can support it by becoming a GitHub Sponsor. Or you can Buy Me a Coffee. I'll send you an Open Data Rottweiler sticker. You're receiving this email because you subscribed to Quantum of Sollazzo, a weekly newsletter covering all things data, written by Giuseppe Sollazzo (@puntofisso). If you have a product or service to promote and want to support this newsletter, you can sponsor an issue. |
✨ Topical
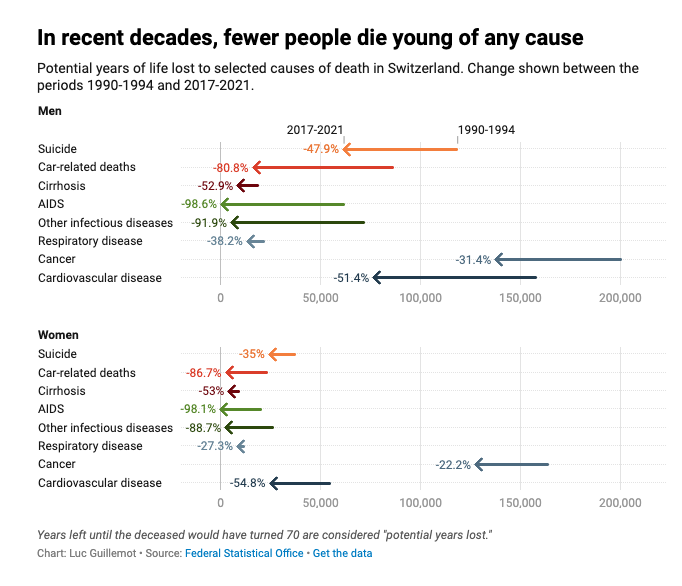
Why do Swiss people die?
Luc Guillemot for Datawrapper: "In the 1990s, the artist Christian Boltanski created La réserve des suisses morts, a series of installations using portraits from the obituary section of a Swiss local newspaper". He takes inspiration.
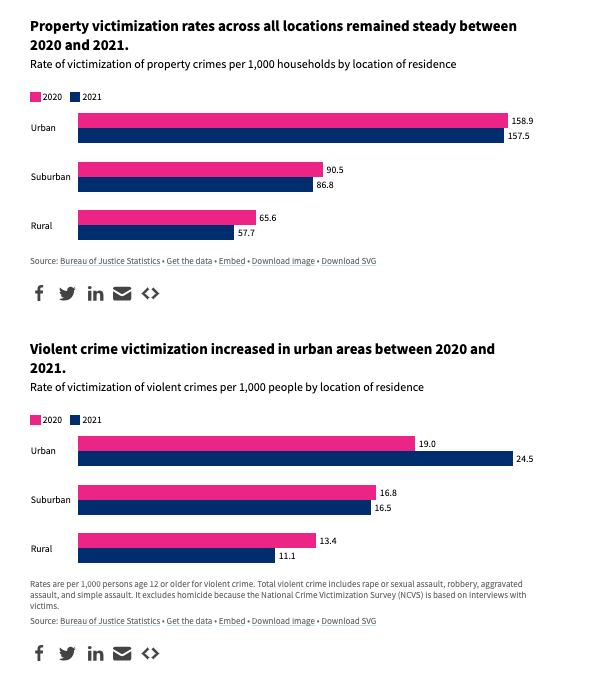
Where are crime victimization rates higher: urban or rural areas?
USAFacts: "Crime victimization rates are higher in urban than rural areas, but despite a rise in urban violent crime victimizations reported in 2021, rates have been falling for decades."
Grand Old Party: How Aging Makes You More Conservative
The Wall Street Journal: "Baby boomers have shifted right. But liberal millennials and Gen Z are canceling them out."

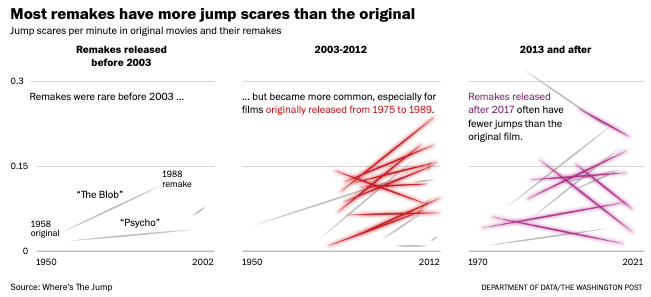
What’s killing the jump scare?
"Since 2014, the number of jump scares cranked out by Hollywood has fallen precipitously, according to Where’s The Jump, a remarkable catalog of over 1,000 movies that documents the time stamps of slamming doors, sudden attacks, and other startling moments that can make viewers jump."
Etse-Ada Systems. All in one suite of customisable web tools and support for managing your business operations - including websites, professional emails and an ERP consisting of CRM, accounting, project management, service/product management, and many more features. Learn more & Start a free trial.
🛠️📖 Tools & Tutorials
RTutor
"RTutor uses OpenAI's powerful large language model to translate natural language into R code, which is then executed. You can request your analysis, just like asking a real person. Upload a data file (CSV, TSV/tab-delimited text files, and Excel) and just analyze it in plain English. Your results can be downloaded as an HTML report in minutes!"
What do I think of it? ...
cccolor
"HEX, RGB & HSL color picker."

What Every Developer Should Know About GPU Computing
"A primer on GPU architecture and computing."
Creative Coding
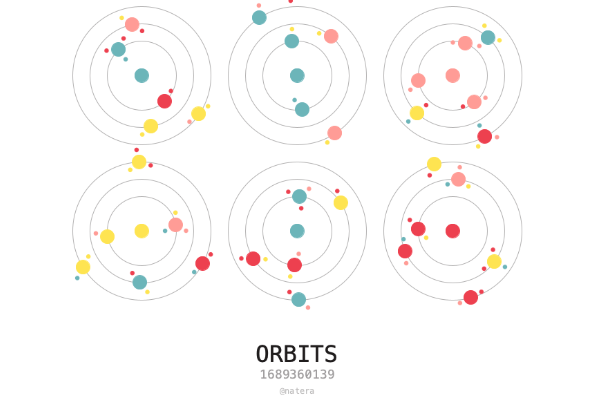
Luis Natera's set of generative visual algorithms.
Embeddings: What they are and why they matter
Simon Willison: "Embeddings are a really neat trick that often come wrapped in a pile of intimidating jargon.
If you can make it through that jargon, they unlock powerful and exciting techniques that can be applied to all sorts of interesting problems."
This is a structured write-up of his talk at PyBay 2023.
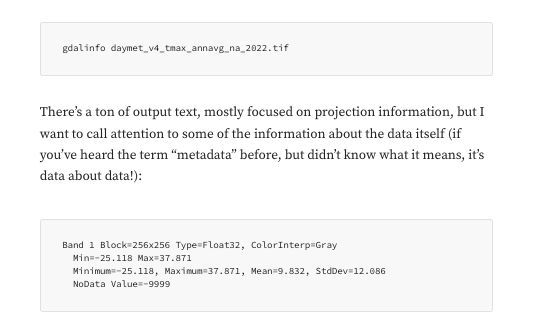
A Gentle Introduction to GDAL Part 6.1: Visualizing Data
I just link to this part because it talks about satellite imagery, but the whole series is strongly recommended if you want to get to grasp geographic data manipulation library GDAL.
Intel Techniques
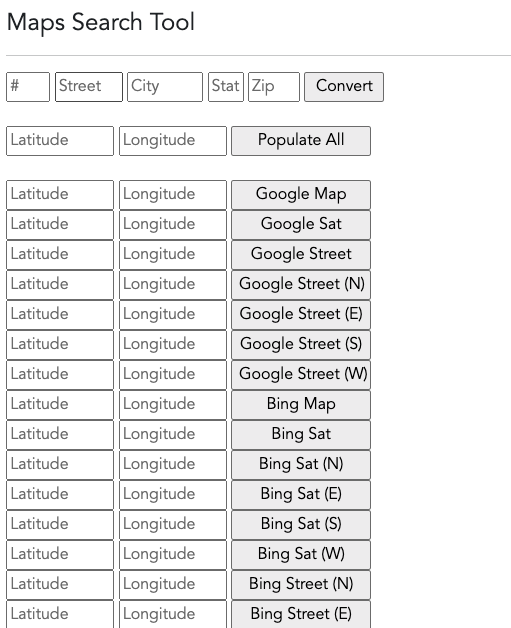
A website that offers a set of tools as a compendium to a popular OSINT book. Here's a screenshot of the map search tool.
Joining CSV Data Without SQL
"An IP Geolocation Use Case."
This uses Zed, a package developed by the author's company.
🤯 Data thinking
How vote in the US Congress unfolds
US Representatives vote in alphabetical order. This week's Washington Post's How to Read This Chart looks at a very intriguing chart and explains how things unfold.
"It shows how voting in the House unfolds on roll-call votes. In other words, when the House is tallying votes member by member — as it had the opportunity to do three times this week — Mohn’s chart (and mine) shows which party leads or trails as the list of legislators is completed."

📈Dataviz, Data Analysis, & Interactive
Manhattan has lots of people and lots of tall buildings.
"But the people aren't in the tall buildings."

The Choice: A visual history of Australian Referendums
Although this Tableau visualization was not updated after the latest referendum, it's a pretty good dataviz. Which made me realise that Northern Territory wasn't fully granted autonomy (what is called "Responsible Government") until the late 1970s.

In search of the least viewed article on Wikipedia
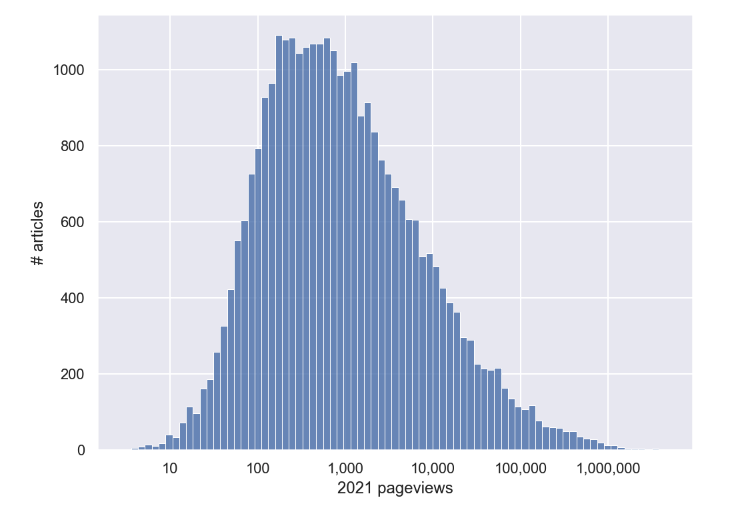
"Though Wikipedia page view data is publicly available (as a massive raw data dump, and through an API), there’s unfortunately no easy way to sort out the least viewed pages, short of a very slow linear search for the needle in the haystack…"
Colin Morris shows how to do it.
Also interesting to discover that the "Random article" isn't in fact that random at all.
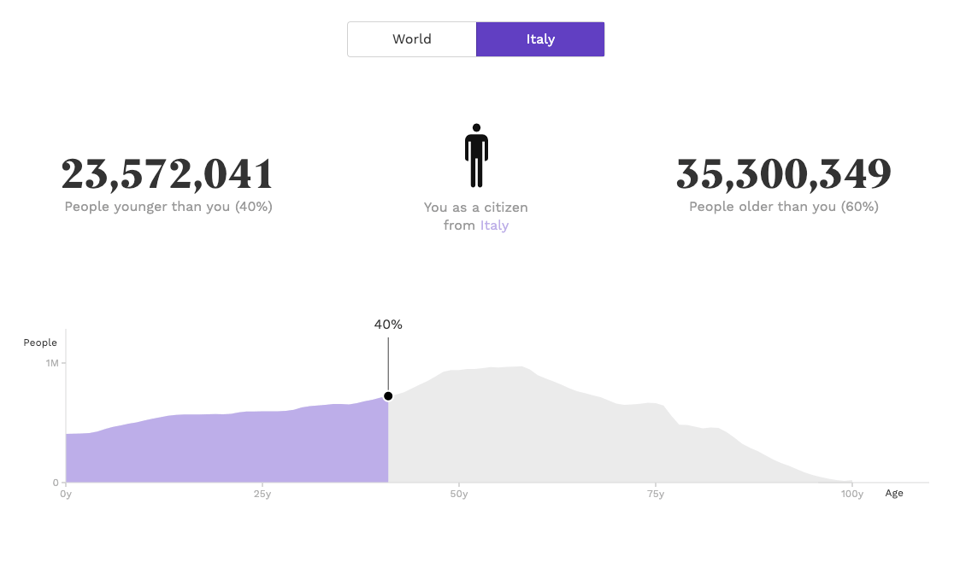
What's my place in the world population? How long will I live?
"The journey of your life in numbers and dates!"
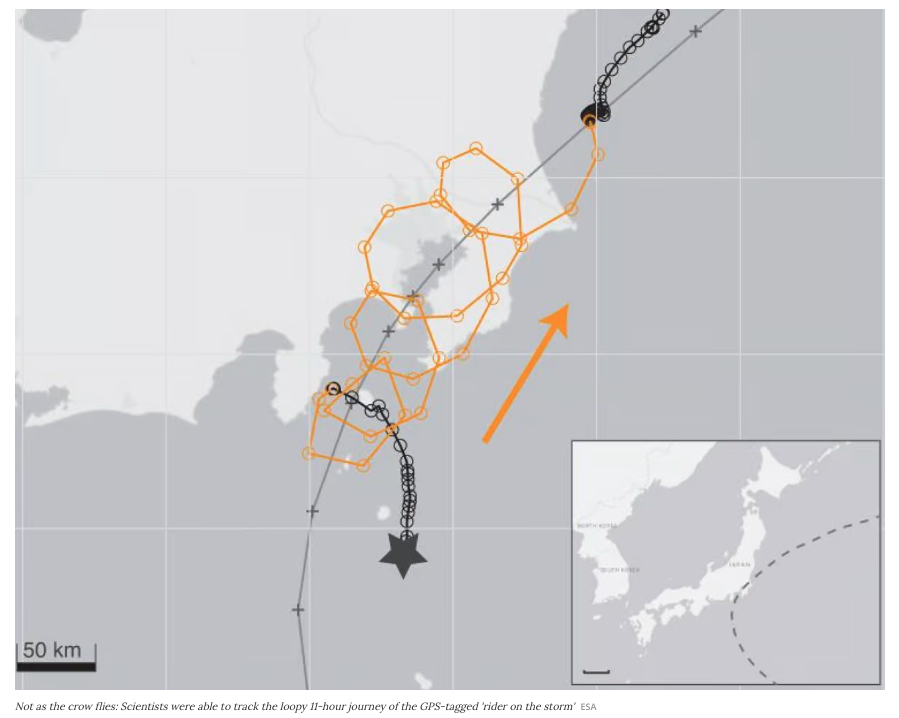
Bird takes on typhoon for an insane 700-mile sky-high ride of his life
Minor dataviz here, but it's pretty cool.
Storytelling vs. Exploring, With Global Happiness Data
"A meta analysis on data visualization".

quantum of sollazzo is also supported by Andy Redwood’s proofreading – if you need high-quality copy editing or proofreading, check out Proof Red. Oh, and he also makes motion graphics animations about climate change.

Supporters*
Alex Trouteaud
casperdcl / iterative.ai
Naomi Penfold
[*] this is for all $5+/months Github sponsors. If you are one of those and don't appear here, please e-mail me
