533: quantum of sollazzo
#533: quantum of sollazzo – 5 September2023
The data newsletter by @puntofisso.

Hello, regular readers and welcome new ones :) This is Quantum of Sollazzo, the newsletter about all things data. I am Giuseppe Sollazzo, or @puntofisso. I've been sending this newsletter since 2012 to be a summary of all the articles with or about data that captured my attention over the previous week. The newsletter is and will always (well, for as long as I can keep going!) be free, but you're welcome to become a friend via the links below.
I've been in my new job for a week. I'm very happy to be back working on data, especially with a product and service management hat. I've already met quite a few people in the team, and learning more and more about the existing architecture and ways of working. Onwards!
Also, I'll be away for a few days next week, so Quantum will probably be on holiday for a couple of weeks. So I've added a few more links this week, and I'll be back with the usual double whopper.
The most clicked link last week was Unearthed's investigation on sewage spills in England and Wales.
'till next issue,
Giuseppe @puntofisso
|
Before you go... DO YOU LIKE QUANTUM OF SOLLAZZO? → BECOME A SUPPORTER! :) If you enjoy this newsletter, you can support it by becoming a GitHub Sponsor. Or you can Buy Me a Coffee. I'll send you an Open Data Rottweiler sticker. You're receiving this email because you subscribed to Quantum of Sollazzo, a weekly newsletter covering all things data, written by Giuseppe Sollazzo (@puntofisso). If you have a product or service to promote and want to support this newsletter, you can sponsor an issue. |
✨ Topical
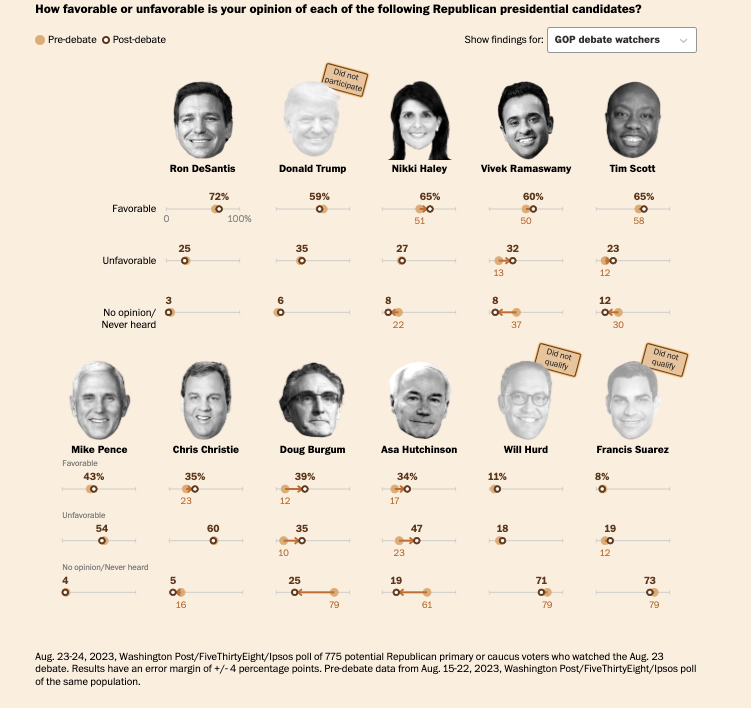
Who Won The First Republican Debate?
"We partnered with Ipsos and The Washington Post to poll voters before and after the candidates took the stage."
Quite a bit to digest in this article by FiveThirtyEight, including some pretty good graphics that make it very easy to understand which direction different candidates are leaning.

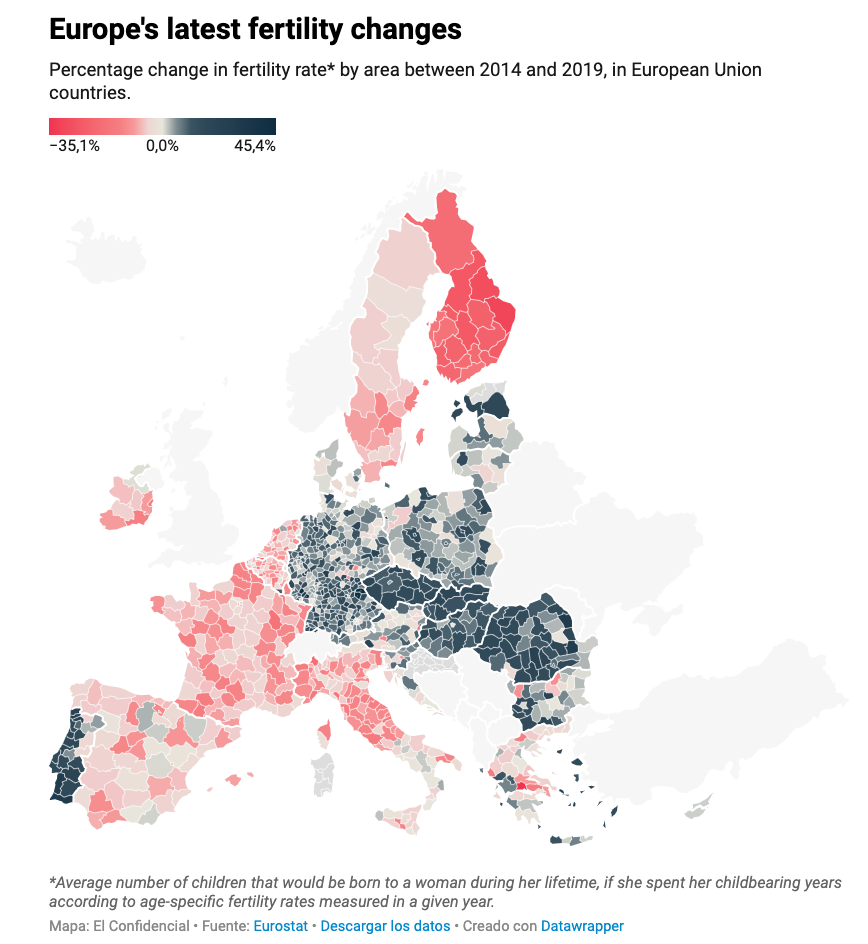
Birth rates are falling even in Nordic countries: stability is no longer enough
"Fertility declines across the European Union, with the South lagging behind. Birth rates in northern countries also show signs of decline as the causes become more structural and unrelated to wealth and stability. What's going on? A data-story."
From the European Journalism Network, a good look at Eurostat data,
Our Republican debate poll finds Ron DeSantis and Vivek Ramaswamy won
"Here’s how debate watchers thought all the candidates performed Wednesday night."
Produced by the Washington Post with FiveThirtyEight, it's a variation of the article above.
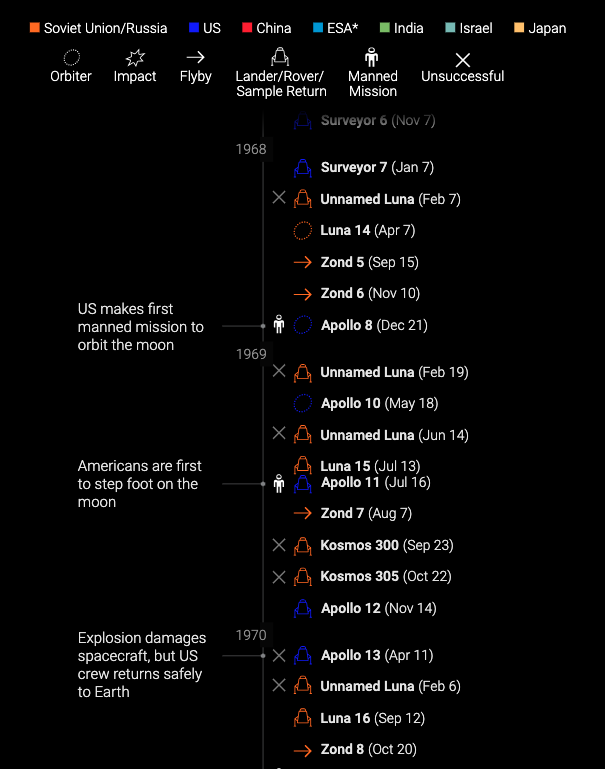
The new moon race
The South China Morning Post has this brilliantly visual article on the moon landings.
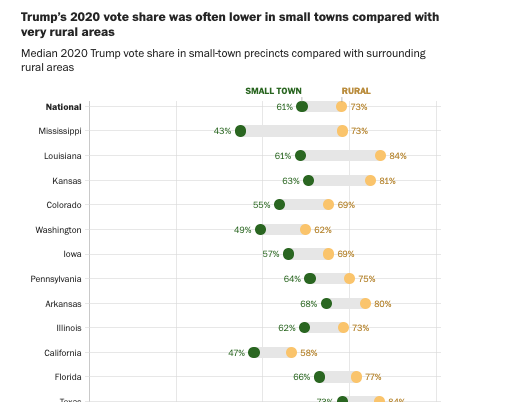
Small towns don’t vote like other rural areas
Great analysis by the Washington Post here.
"“When you get out into rural America, it’s actually a lot more heterogeneous than people imagine it to be,” said Jonathan Rodden, political scientist and author of the book “Why Cities Lose: The Deep Roots of the Urban-Rural Political Divide.”"
Mapping where the earth will become uninhabitable
The Berliner Morgenpost: "Lethal heat, flooded coastlines, powerful hurricanes, water scarcity: climate models show that by the end of the century, life as normal won’t be possible in many places. Find out where populations are projected to be hit hardest with our 3D interactive visualisation."

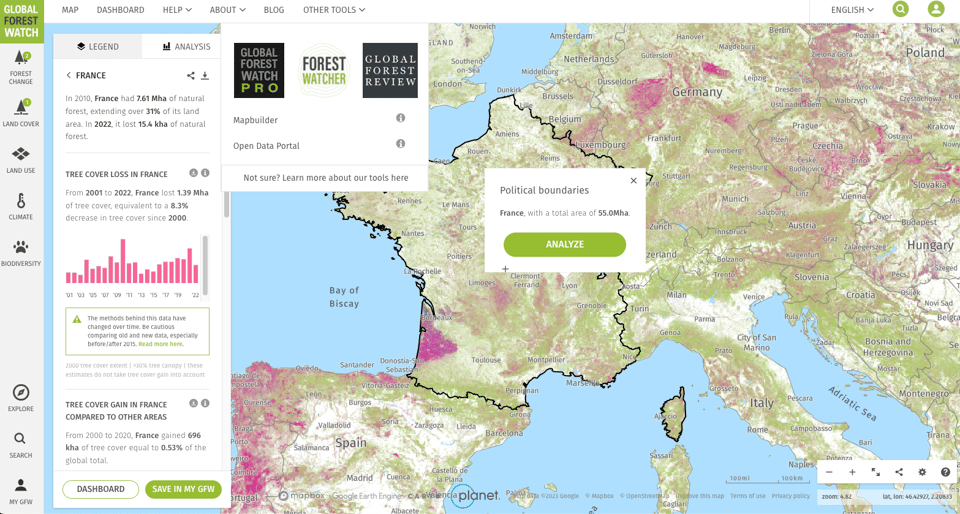
Global Forest Watch
"Global Forest Watch (GFW) is an online platform that provides data and tools for monitoring forests."
They do a few things, but I'm mostly linking because of their map.
Superbugs: why it’s so hard to stop the ‘silent pandemic‘
The Financial Times looks at antimicrobial resistance.
(via Peter Wood)

🛠️📖 Tools & Tutorials
Python for Data Science
New online book by the ONS Data Science Deputy Director Dr Arthur Turrell, which aims to "give you the skills you need to code for data science". Arthur says that the book is "suitable for people who have some familiarity with the ideas behind programming and coding but who don’t yet know how to do data science.".
chartbrew
"Open-source web platform used to create live reporting dashboards from APIs, MongoDB, Firestore, MySQL, PostgreSQL, and more."
The website (shareware model) is here, but take also a look at the GitHub repository.

Bézier curves
Richard Ekwonye: "I only recently took an interest in understanding the underlying logic that governs their behaviour. This demystified curve-related path commands for me and gave me a deeper understanding of web animations. In this article, I’ll share my interesting findings on Bézier curves."

peaks.js
"Peaks.js is a JavaScript component that allows users to view and interact with audio waveforms in the browser."
It's developed by the BBC R&D team.

FFmpeg Explorer
A web-based tool to explore and apply FFmpeg filters.

Visualgo
A website "visualising data structures and algorithms through animation".

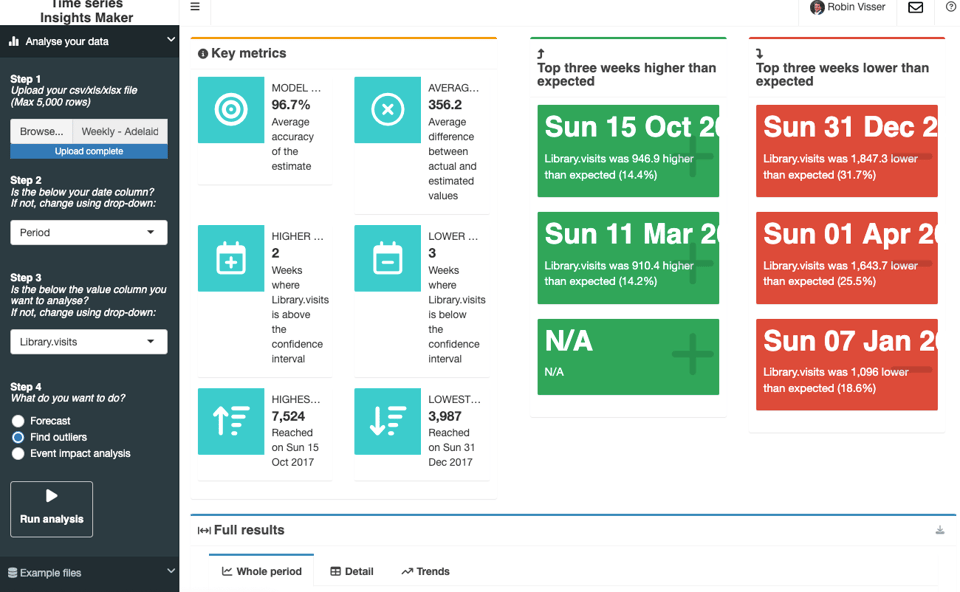
Time series analysis made easy using Shiny
"Meet TIM, a new and completely free tool built in Shiny to generate insights from your time series data."
How to create isometric diagrams using SVG
"The purpose of this article is to show how to create and manipulate isometric views in SVG, and how to define these objects using, in particular, the JointJS library."
JointJS, if you didn't know, is a JavaScript diagramming library which creates pretty cool modern looking diagrams. It has an open source release under the MPL 2.0.

From static to interactive: turn SVG diagrams into exciting experiences on your website
Flourish has released a new "Interactive SVG" template which lets users create SVG files with interactive, clickable areas.
I particularly like the idea of creating an interactive floorplan, for some reason.

R for Sign Language Linguistics
"This is a short tutorial intended to give some helpful pointers to those working on sign language data and the programming language R. "
Geographic Data Science with Python
"This book provides the tools, the methods, and the theory to meet the challenges of contemporary data science applied to geographic problems and data. "

🤯 Data thinking
Web Scraping for Me, But Not for Thee (Guest Blog Post)
A critical article looking at corporate approaches to web scraping. It's a controversial topic in many ways: "Some of the biggest companies on earth—including Meta and Microsoft—take aggressive, litigious approaches to prohibiting web scraping on their own properties, while taking liberal approaches to scraping data on other companies’ properties."
It was the worst of charts…
Interesting discussion on the latest issue of "How to Read This Chart" about the controversial use of different scales on the left and right of the Y-axis.
📈Dataviz, Data Analysis, & Interactive
Luca Brecel's Path to becoming Snooker World Champion
I don't understand anything about snooker, but this interactive Tableau viz is pretty cool.

Renting vs. Owning a Home, by State
One of Nathan Yau's amazing analyses of the American Community Survey (part of the US Census).

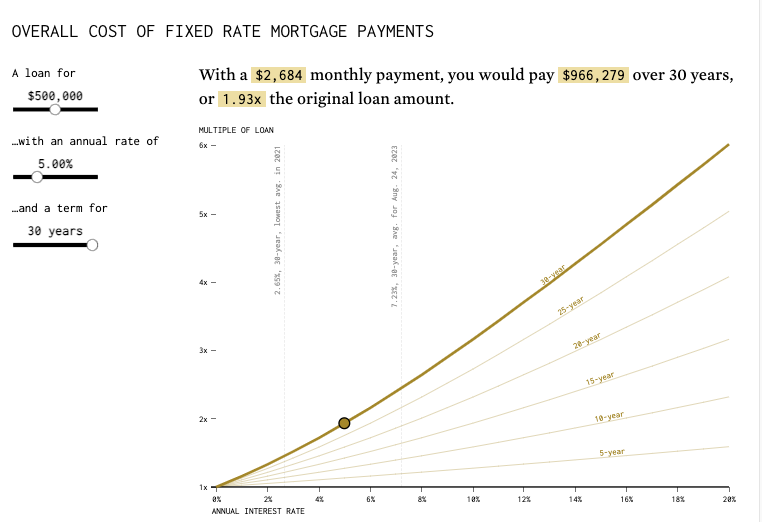
When the Cost of a Mortgage is a Multiple of the Original Loan
And another one from Nathan Yau - an interactive simulator of mortgage lifetime payments.
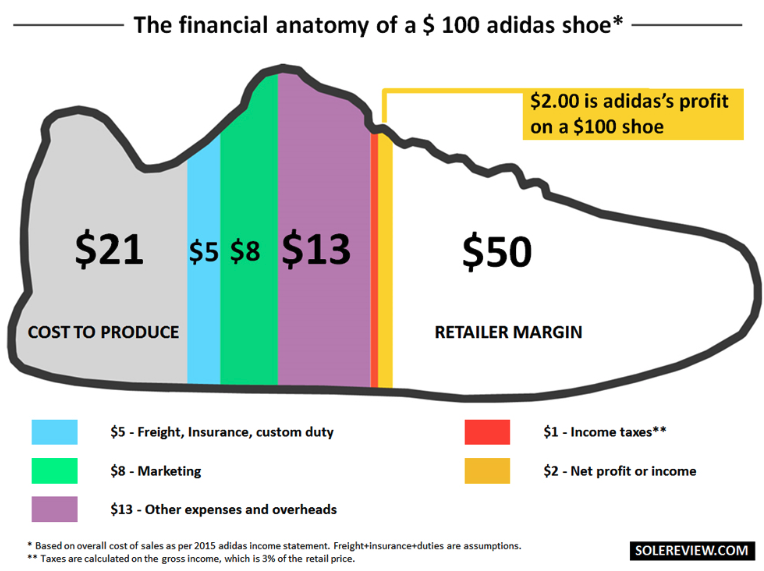
What does it cost to make a running shoe?
Does it really cost 2 USD to produce Nike shoes? This article analyses the cost with some... picturesque visualizations.
(via Peter Wood)
🤖 AI
The governance of artificial intelligence: interim report
The House of Commons Science, Innovation, and Technology Committee has just published this interim report.
"The 12 challenges of AI governance that must be addressed by policymakers:
1. The Bias challenge
2. The Privacy challenge
3. The Misrepresentation challenge
4. The Access to Data challenge
5. The Access to Compute challenge
6. The Black Box challenge
7. The Open-Source challenge
8. The Intellectual Property and Copyright Challenge
9. The Liability challenge
10. The Employment challenge
11. The International Coordination challenge
12. The Existential challenge"
(via Massimo Conte)
quantum of sollazzo is also supported by Andy Redwood’s proofreading – if you need high-quality copy editing or proofreading, check out Proof Red. Oh, and he also makes motion graphics animations about climate change.

Supporters*
Alex Trouteaud
casperdcl / iterative.ai
Naomi Penfold
[*] this is for all $5+/months Github sponsors. If you are one of those and don't appear here, please e-mail me