524: quantum of sollazzo
#524: quantum of sollazzo – 4 July 2023
The data newsletter by @puntofisso.

Hello, regular readers and welcome new ones :) This is Quantum of Sollazzo, the newsletter about all things data. I am Giuseppe Sollazzo, or @puntofisso. I've been sending this newsletter since 2012 to be a summary of all the articles with or about data that captured my attention over the previous week. The newsletter is and will always (well, for as long as I can keep going!) be free, but you're welcome to become a friend via the links below.
The most clicked link last week was the interesting article on how map projections distort our perception of the world. I knew you were a bunch of map geeks.
'till next week,
Giuseppe @puntofisso

Introducing The 1st Richmond CDO Forum.
Richmond Events Ltd. is thrilled to announce the launch of its 1st forum for Chief Data Officers – The Richmond CDO Forum. With a rich history of delivering impactful gatherings that foster innovation and collaboration, Richmond Events has been at the forefront of connecting industry professionals and thought leaders for over thirty years.
The inaugural Richmond CDO Forum aims to foster collaboration, exchange ideas, and address the challenges faced by CDOs in today's digital landscape. This forum will provide an opportunity for CDOs to connect, learn, and drive transformational initiatives across industries.
The forum will feature sessions led by thought leaders, industry experts, and accomplished CDOs, focusing on key topics such as data governance, privacy and security, AI and machine learning, and data monetization.
With a strong focus on thought leadership, the Richmond CDO Forum promises to deliver captivating keynote speeches, thought-provoking panel discussions, and interactive workshops led by industry visionaries and experts.
Participants will have the opportunity to dive deep into crucial topics such as data governance and ethics, artificial intelligence and machine learning, data strategy and innovation, data analytics and visualization, and emerging technologies.
The Richmond CDO Forum will take place on 16th to 17th September 2024 at the Fairmont Windsor Park.
If you are a CDO, or are interested in meeting CDOs, please contact Liam Quinn for more information at lquinn@richmondevents.com
✨ Topical
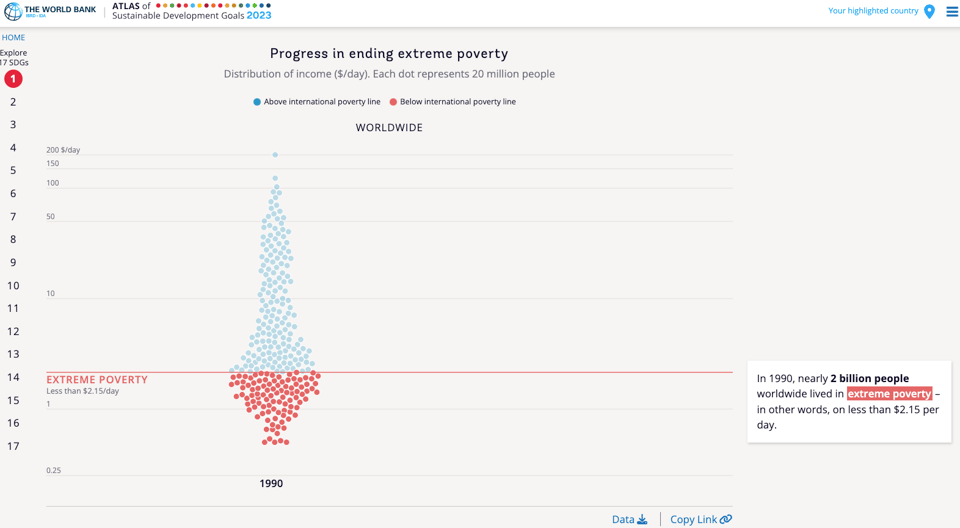
ATLAS of Sustainable Development Goals 2023
"The Atlas of Sustainable Development Goals 2023 presents interactive storytelling and data visualizations about the 17 Sustainable Development Goals."
By the World Bank.
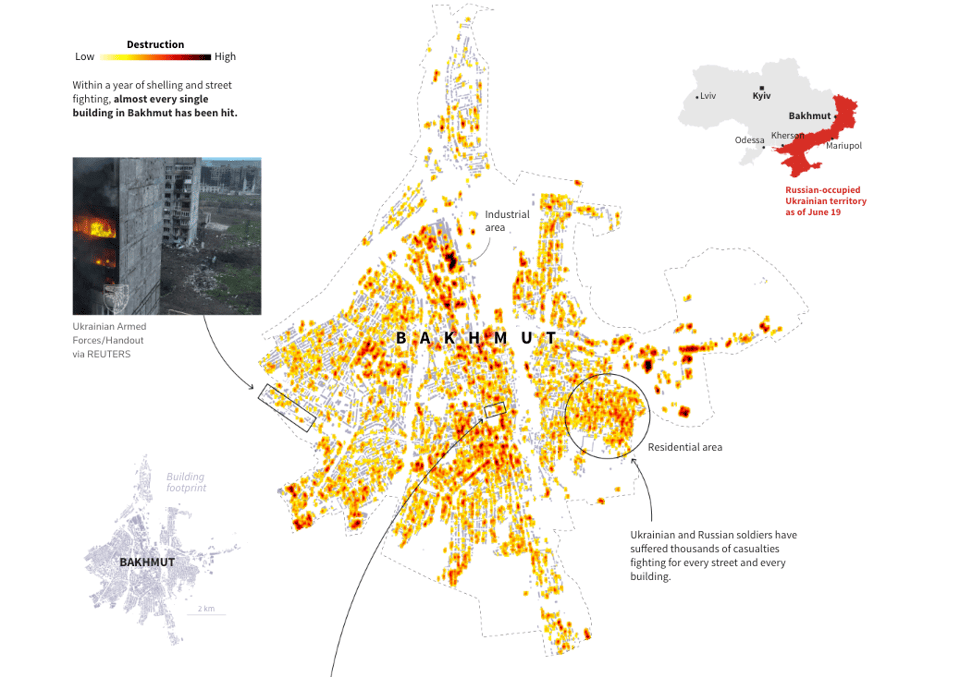
Mapping Ukraine’s counteroffensive
Article by Reuters, which includes the brilliant map below.
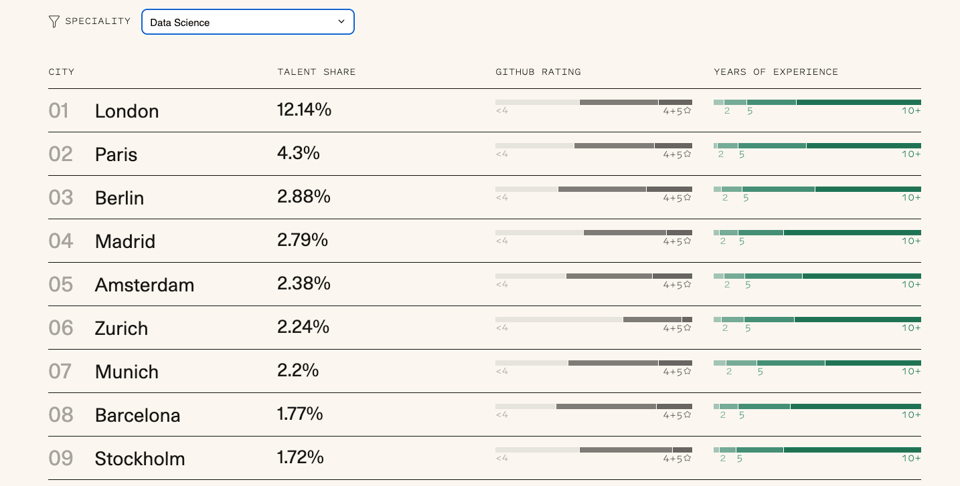
Sequoia’s interactive guide to Europe’s technical talent
Sequoia Capital has released this interactive take on the state of tech workers in Europe.
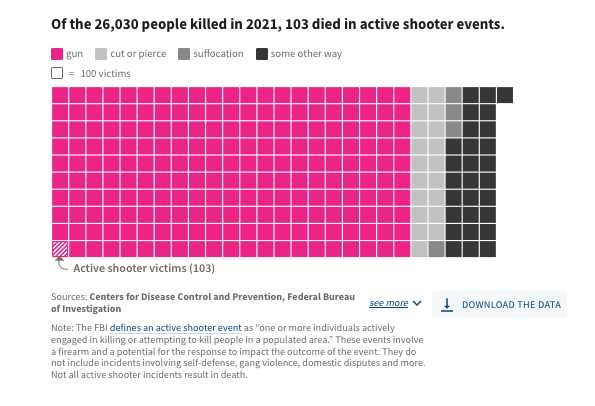
Gun homicides have reached rates not seen since the 1990s
"In 2021, 81% of all homicides in the US were due to firearm-related injuries."
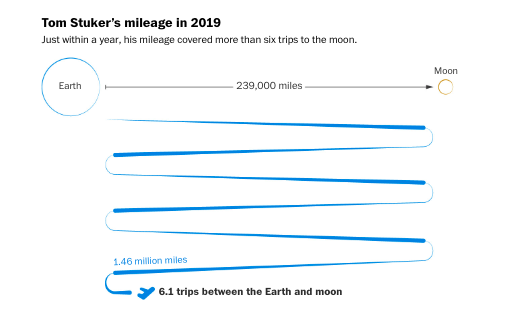
He has flown 23 million miles. Here are his travel secrets.
Some good dataviz in this article. Btw, he's got a slightly enormous carbon footprint...
🛠️📖 Tools & Tutorials
IRE23 Tipsheets & Audio
A lot of slides, tipsheets, and code from IRE23, the Investigative Reporters & Editors conference.
Mycelite
"Mycelite is a SQLite extension that allows you to synchronize changes from one instance of SQLite to another."
Local-first is the idea that you can take the best from local applications and client-server ones.
Flowbite Icons - Free and open-source SVG icons
A collection of "437 free and open-source SVG icons."
Mosaic: Scalable, interactive data visualizations
"Mosaic is an extensible framework for linking databases and interactive views." More on Github.
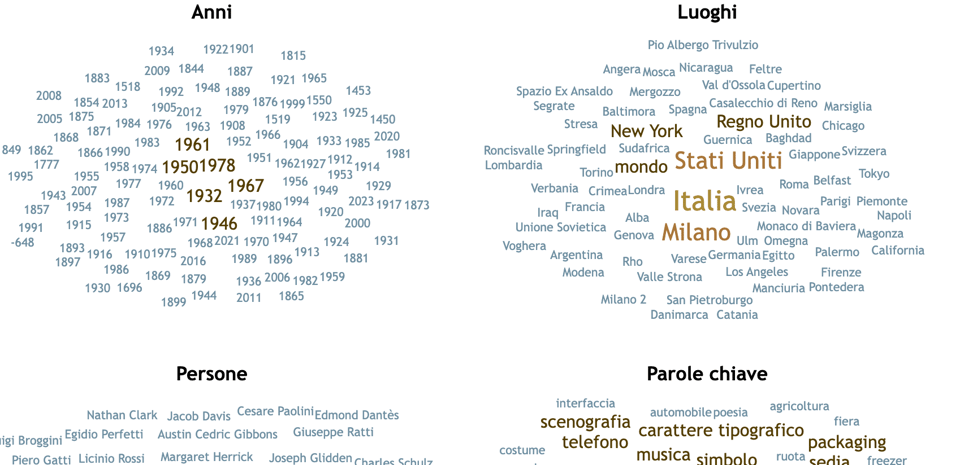
jQCloud
A simple jQuery plugin to create word clouds: "jQCloud is a jQuery plugin that builds neat and pure HTML + CSS word clouds and tag clouds that are actually shaped like a cloud (otherwise, why would we call them 'word clouds'?)."
Alessandro, who sent it to me, used in this looks analysis of the episodes of a popular podcast (automatic English translation available here).
Quantile Loss & Quantile Regression
"Learn how to adjust regression algorithms to predict any quantile of data".
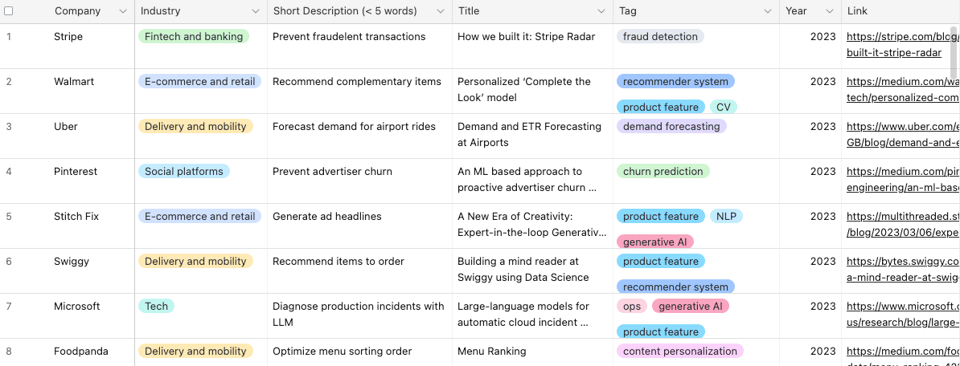
ML system design: 200 case studies to learn from
"How do companies like Netflix, Airbnb, and Doordash apply machine learning to improve their products and processes? We put together a database of 200 case studies from 64 companies that share practical ML use cases and learnings from designing ML systems."
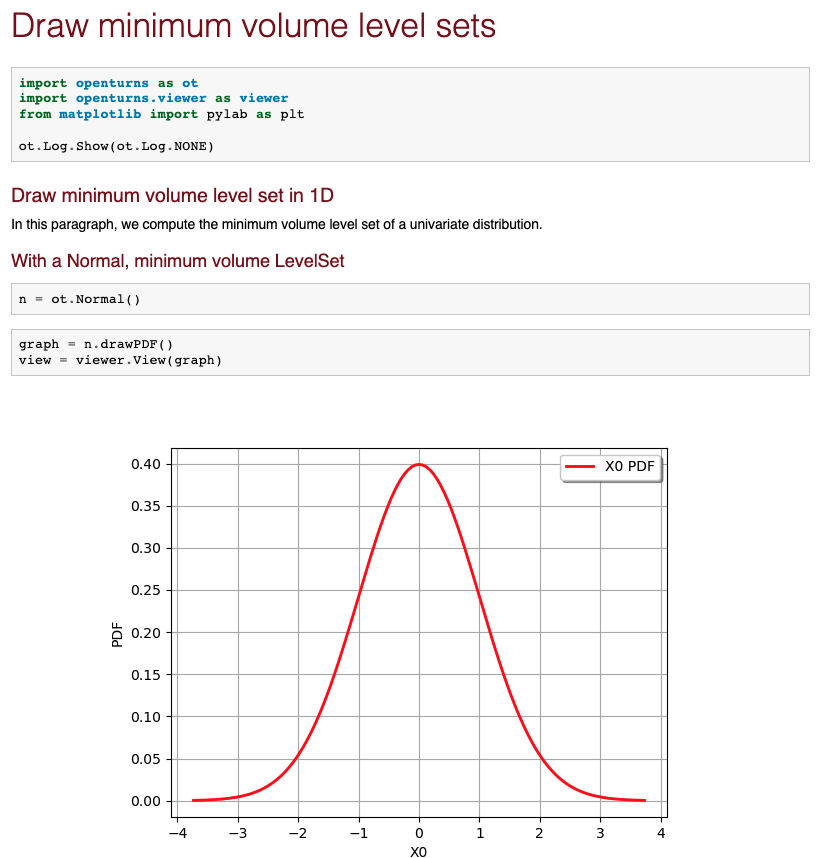
Probabilistic modeling
A gallery with code in Python.
|
DO YOU LIKE QUANTUM OF SOLLAZZO? BECOME A SUPPORTER! :) → If you enjoy this newsletter, you can support it by becoming a GitHub Sponsor. Or you can Buy Me a Coffee. I'll send you an Open Data Rottweiler sticker. You're receiving this email because you subscribed to Quantum of Sollazzo, a weekly newsletter covering all things data, written by Giuseppe Sollazzo (@puntofisso). If you have a product or service to promote and want to support this newsletter, you can sponsor an issue. |
📈Dataviz, Data Analysis, & Interactive
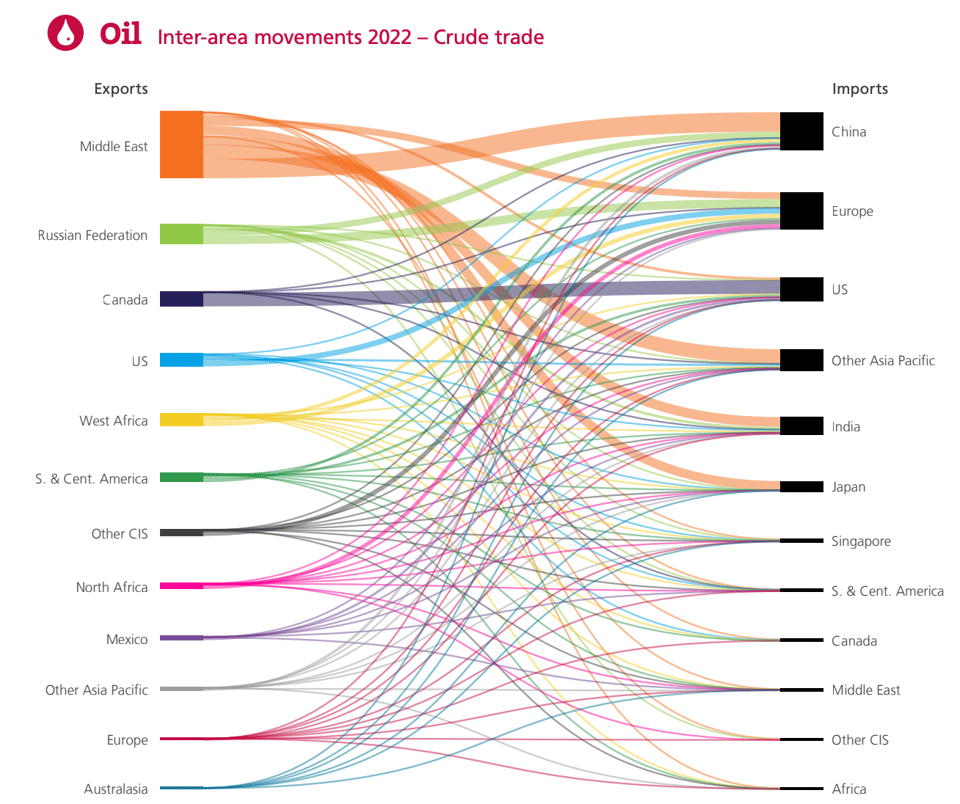
Statistical Review of World Energy
Sankey diagrams are definitely one of my favourite types of chart. The Energy Institute makes some good use of them in their annual statistical review of energy, which has some other interesting stuff.
(via Peter Wood)
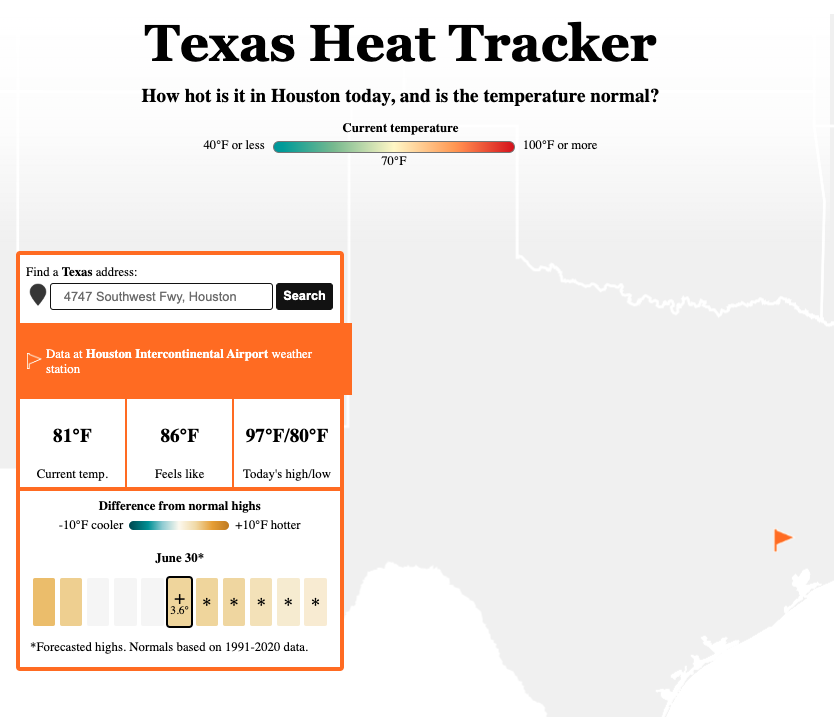
Texas Heat Tracker
"How hot is it in Houston today, and is the temperature normal?".
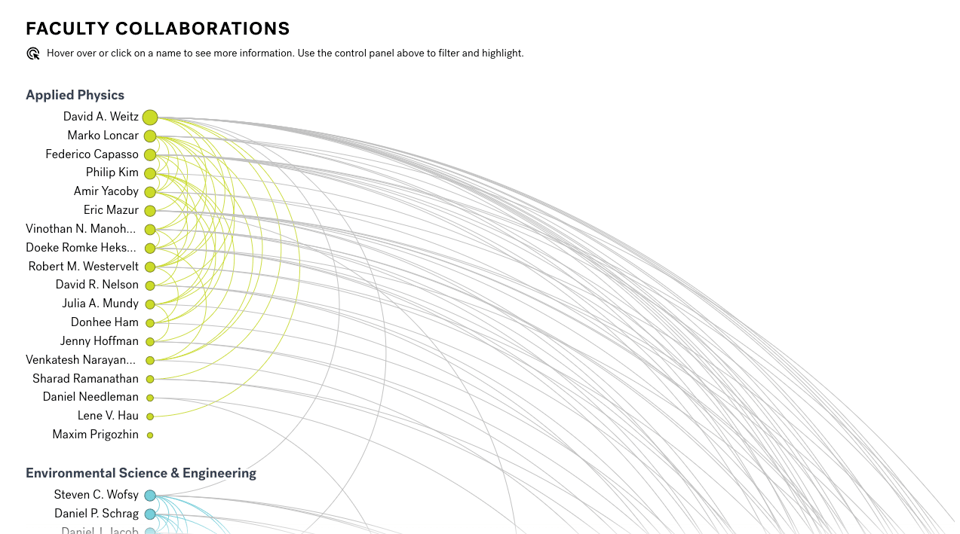
Harvard Faculty Explorer
Including cross-faculty collaborations.
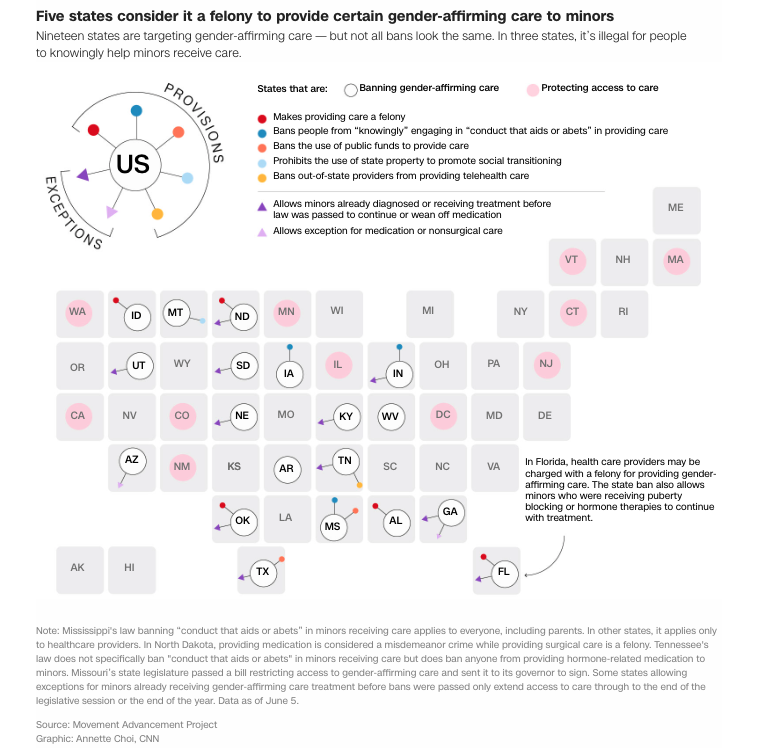
19 states have laws restricting gender-affirming care, some with the possibility of a felony charge
The CNN looks at gender-affirming healthcare legislation, with a really good chart that highlights the several dimensions of this issue.
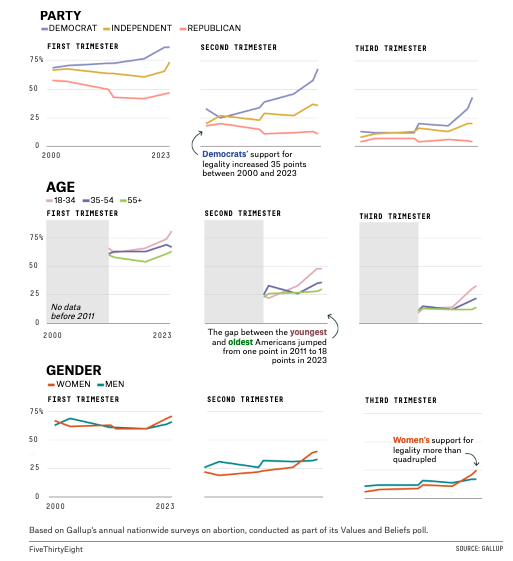
Dobbs Turned Abortion Into A Huge Liability For Republicans
Meanwhile, FiveThirtyEight reports that support for abortion is growing among several groups of Americans.
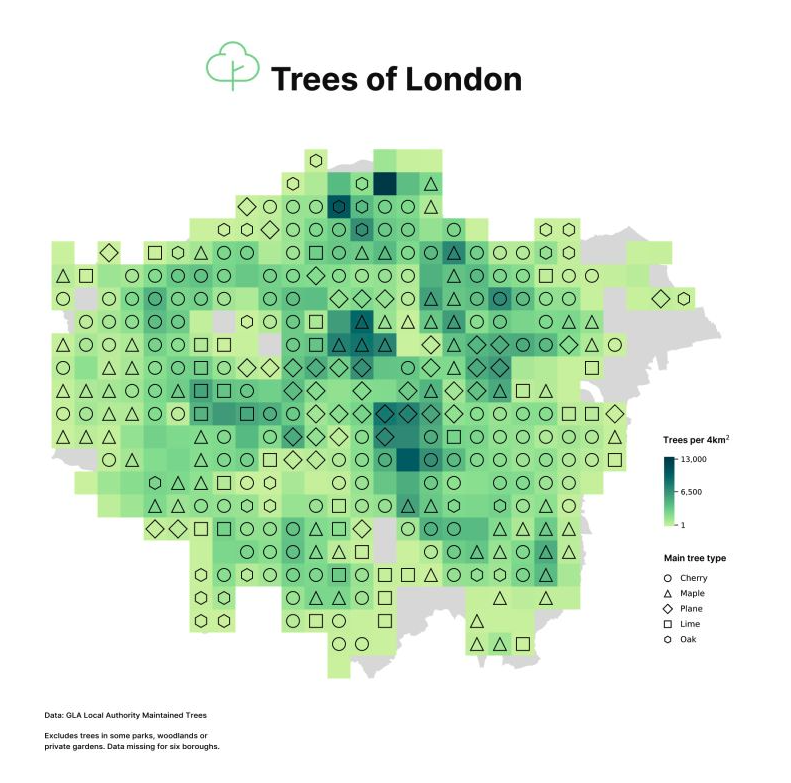
Trees of London
Lisa Hornung has created this beautiful map using data released by the Greater London Authority and, even better, she's released all the code.
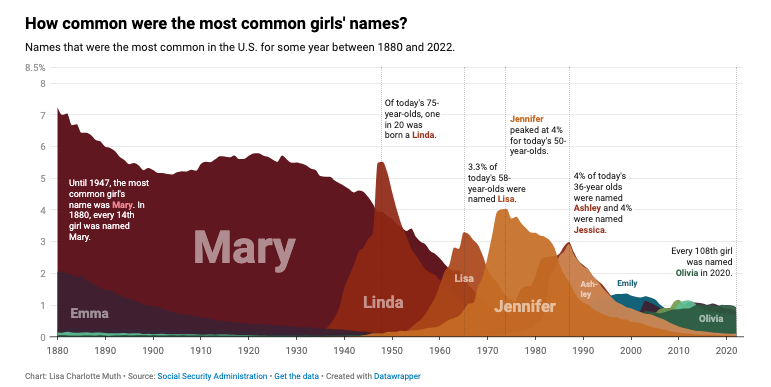
The most common baby names are far less common these days
Perfect chart choice by Datawrapper's Lisa Charlotte Muth.
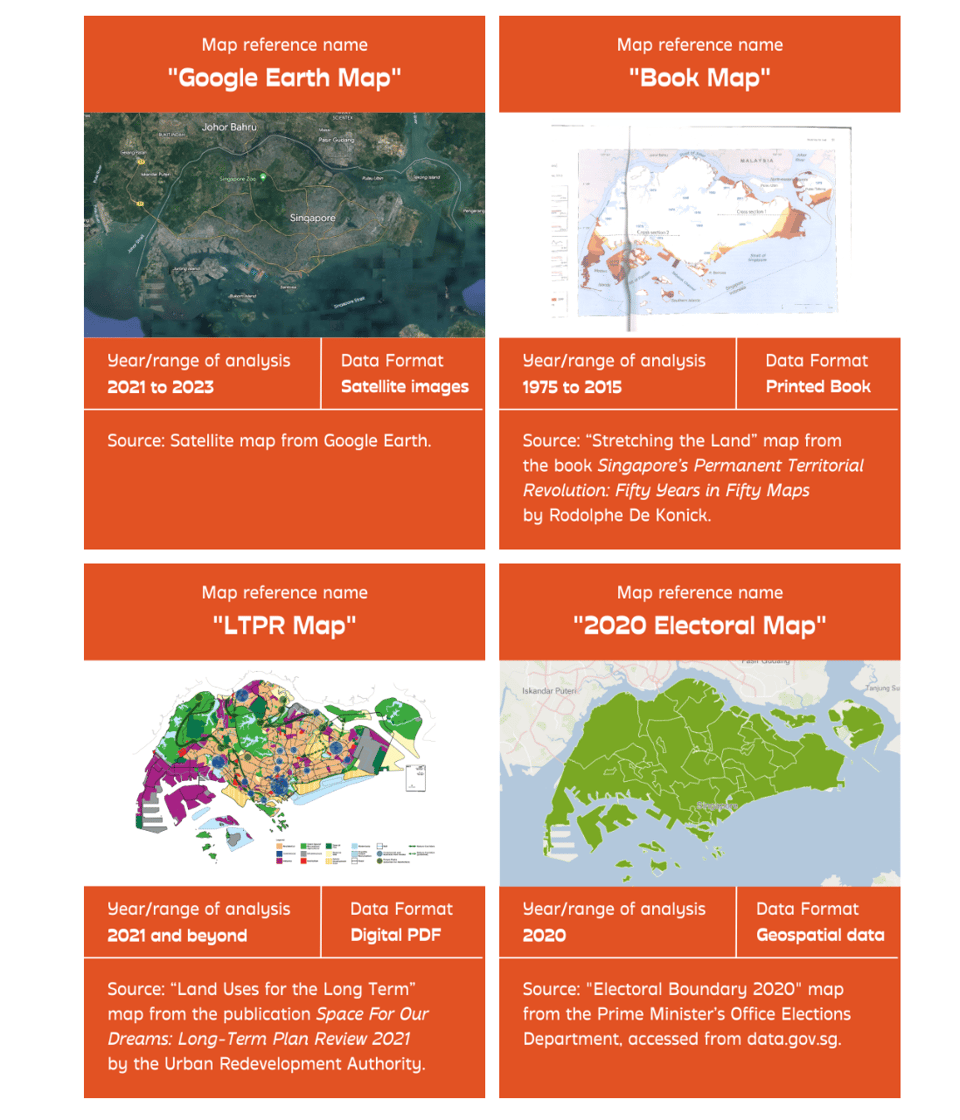
Making a map of land reclamation in Singapore
Kontinentalist have become so good, not just at releasing great dataviz-driven investigations, like this article about land reclamation but also at writing very good explainers.
🤖 AI
Reporting on artificial intelligence: a handbook for journalism educators
A guide released by UNESCO.
"The handbook covers:
* Understanding machine intelligence and identifying different types of AI
- Exploring AI’s potential, as well as its strengths and weaknesses
- Imagining diverse futures with AI by recognising pervasive popular narratives that inform public consciousness
* Understanding journalism’s role in mediating and shaping AI discourse
- Finding ways of reporting about AI in a nuanced, realistic and accountable manner
- Making connections to existing genres of journalism, ranging from general news reporting to data journalism*"
quantum of sollazzo is supported by Andy Redwood’s proofreading – if you need high-quality copy editing or proofreading, check out Proof Red. Oh, and he also makes motion graphics animations about climate change.

Supporters* Alex Trouteaud casperdcl / iterative.ai Naomi Penfold
[*] this is for all $5+/months Github sponsors. If you are one of those and don't appear here, please e-mail me