522: quantum of sollazzo
#522: quantum of sollazzo – 20 June 2023
The data newsletter by @puntofisso.

Hello, regular readers and welcome new ones :) This is Quantum of Sollazzo, the newsletter about all things data. I am Giuseppe Sollazzo, or @puntofisso. I've been sending this newsletter since 2012 to be a summary of all the articles with or about data that captured my attention over the previous week. The newsletter is and will always (well, for as long as I can keep going!) be free, but you're welcome to become a friend via the links below.
Service info: the great folks at Buttondown now offer a way for me to sell sponsorship slots directly, while also reporting openly on the subscriber number, open rates, and click rates. If you're interested in advertising on Quantum, please visit https://buttondown.email/puntofisso/sponsorships.

The most clicked link last week was the dataviz take on Ailing Brussels. Next week, there might be no Quantum as I'm taking most of the week off to rest. But let's see :)
To close off, I have some personal news.
After almost 3 years in the NHS, I've handed in my resignation and will finish in a couple of weeks. I'll take some time off (watch out for my interrail pictures...), then later in Summer I will be the UK Department for Work and Pensions as Head of Data Products and Services. I will be one of a number of Deputy Directors to the Chief Data Officer in one of the most interesting and challenging public sector data directorates within Government and probably the world. This will also be my first "proper" senior civil service placement. I have a lot to learn, but I'm very, very excited. More to follow, when I've had some time to digest everything.
'till next week,
Giuseppe @puntofisso
|
DO YOU LIKE QUANTUM OF SOLLAZZO? BECOME A SUPPORTER! :) → If you enjoy this newsletter, you can support it by becoming a GitHub Sponsor. Or you can Buy Me a Coffee. I'll send you an Open Data Rottweiler sticker. You're receiving this email because you subscribed to Quantum of Sollazzo, a weekly newsletter covering all things data, written by Giuseppe Sollazzo (@puntofisso). If you have a product or service to promote and want to support this newsletter, you can sponsor an issue. |
✨ Topical
Sacking Tucker Carlson has put a dent in Fox News’s ratings
The Economist's Graphic Detail: "Although the channel’s viewers skew conservative, they are open to persuasion from other sources."

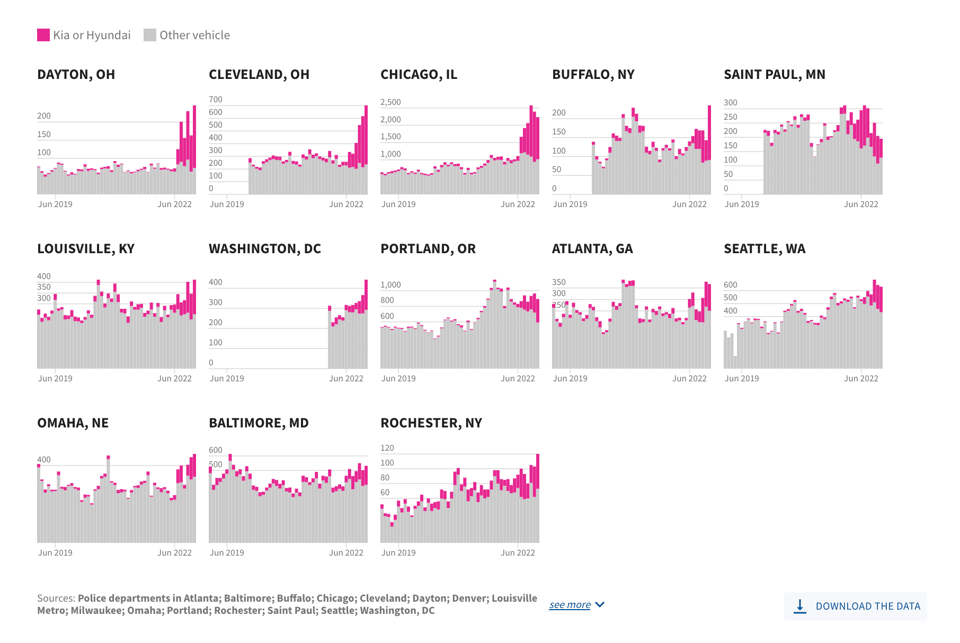
Car thefts are rising. Is a TikTok challenge to blame?
USAFacts investigates a curious surge in thefts of specific car models. Also of note, their look at heatwaves in the US becoming longer and more intense.
Rewiring The Web: The future of personal data
Jon Nash and Charlie Harry Smith at Demos have published an interesting report. "We argue that the widespread use of personal information online represents a fundamental flaw in our digital infrastructure that enables staggeringly high levels of fraud, undermines our right to privacy, and limits competition. To realise a web fit for the twenty-first century, we need to fundamentally rethink the ways in which we interact with organisations online."
Among other things, it features thoughts on interoperability.

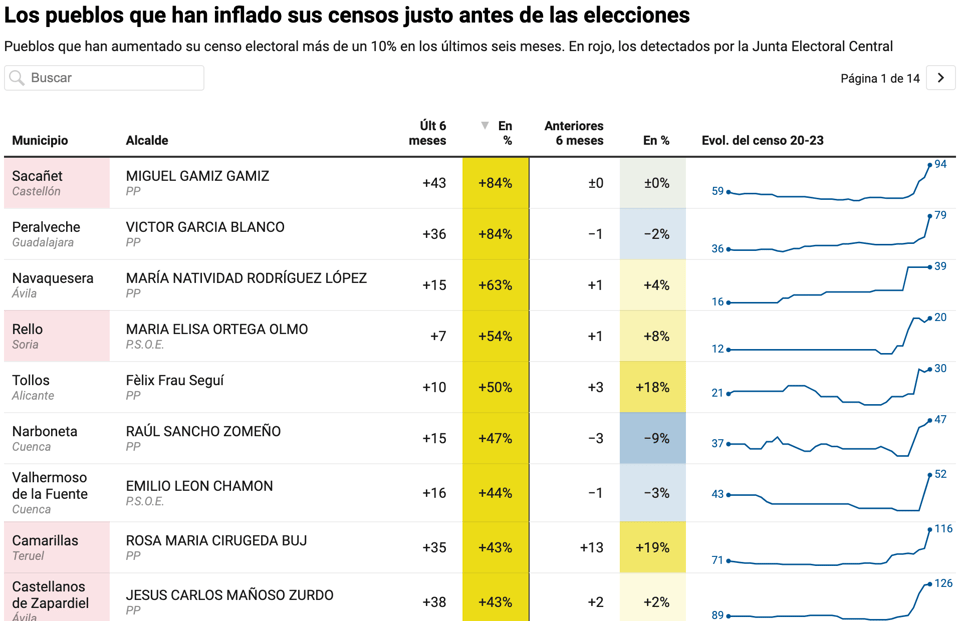
Censos inflados a las puertas del 28M en la España que no sale en los titulares
Original Spanish here and automatically translated into English here, this article takes a look at a interesting phenomenon of voter inflation in Spain: "134 small Spanish municipalities have seen the number of registered people of voting age increase between 10% and 35% in the six months prior to the legal limit".
🛠️📖 Tools & Tutorials
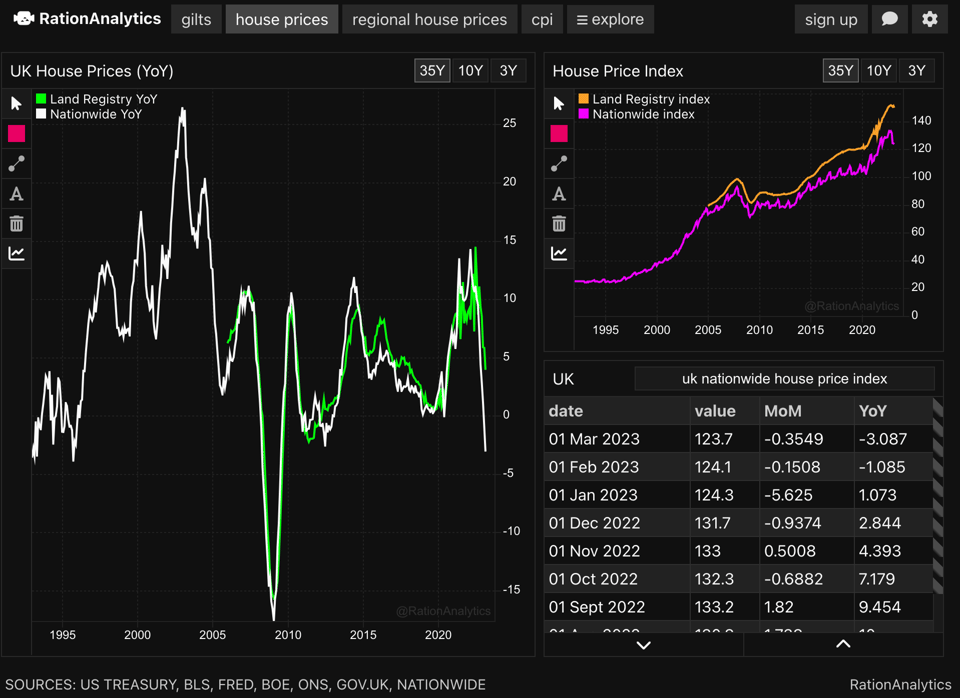
RationAnalytics
Someone has brought together quite a few pieces of stats into one dashboard.
They also explain a bit on reddit.
(via Daniele Bottillo)
Renumics Spotlight
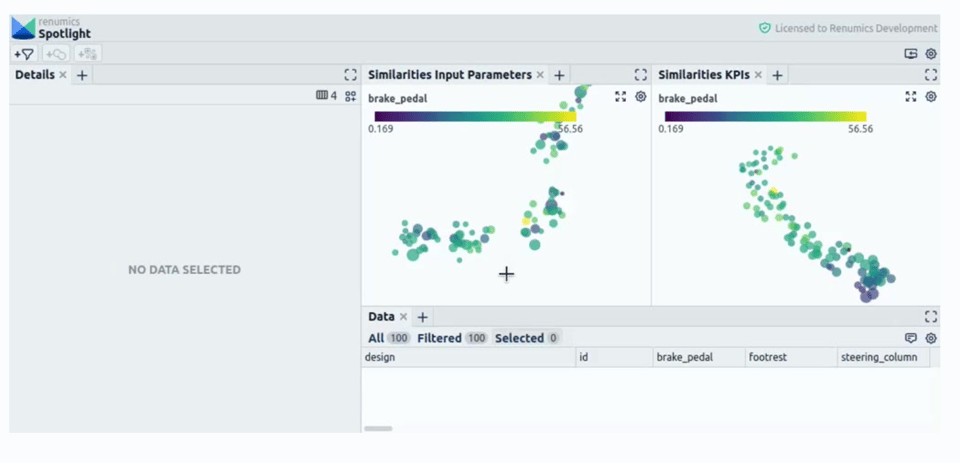
"Open source data curation tooling for unstructured data". Specifically, this is about their product Spotlight: "Spotlight helps you to identify critical data segments and model failure modes. It enables you to build and maintain reliable machine learning models by curating high-quality datasets."
world-server
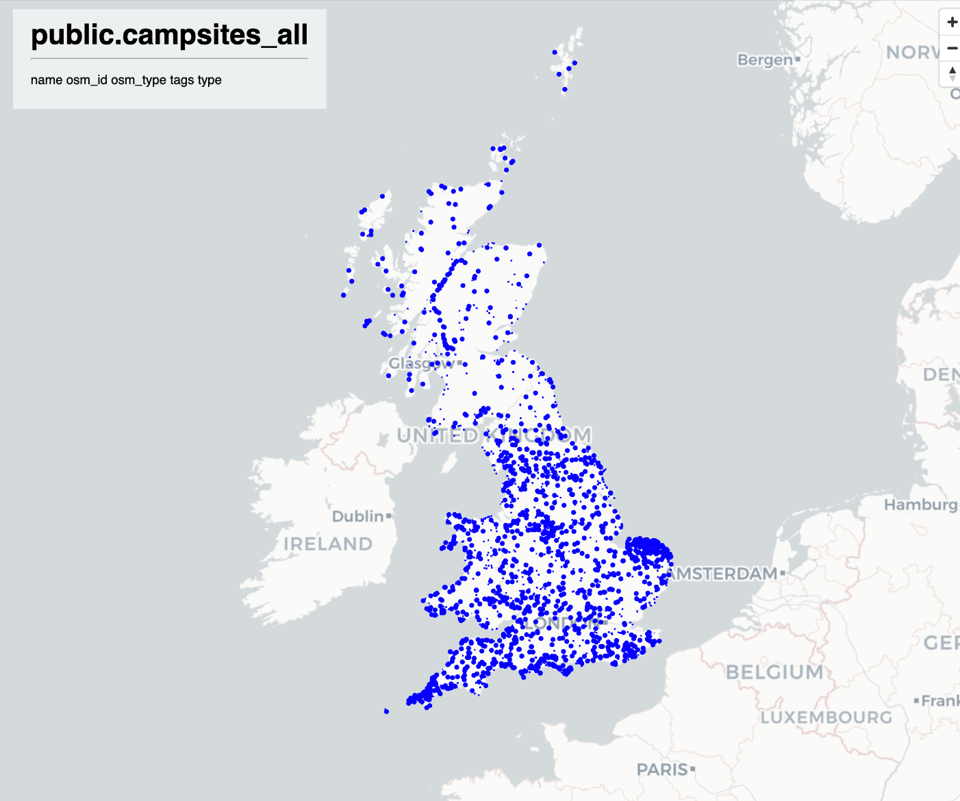
My good friend Lewis Westbury has launched this repository with "Tools and scripts to host your own postgis database and tile server using OpenStreetMap data. By default, these scripts will build a database of campsites in the UK."
"This repository contains scripts to launch a PostGIS geo database and pg_tileserv tile server in Docker containers, and to fetch and import data from Open Street Map.You can configure it to use any data source, and modify the filter script to determine what sort of places to import."
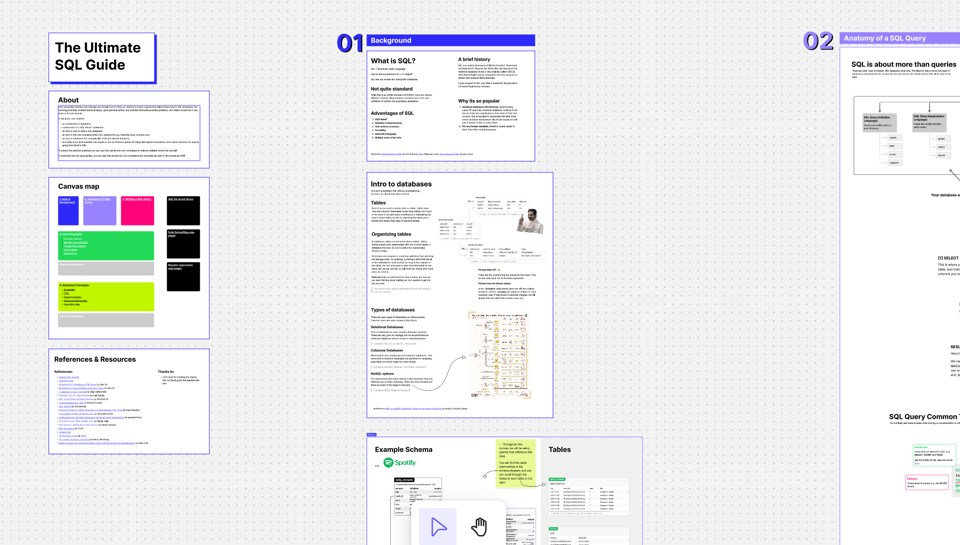
The Ultimate SQL Guide
The folks at Count have created this handy canvas.
SVG versus Canvas: Choosing the right technology for your web application
One of those eternal debates. "In the following article, we will cover some of the same topics you have probably read about elsewhere, but hope to provide you with a more nuanced view. We will also shed some light on what implications those topics have for developers and business owners in practical terms."
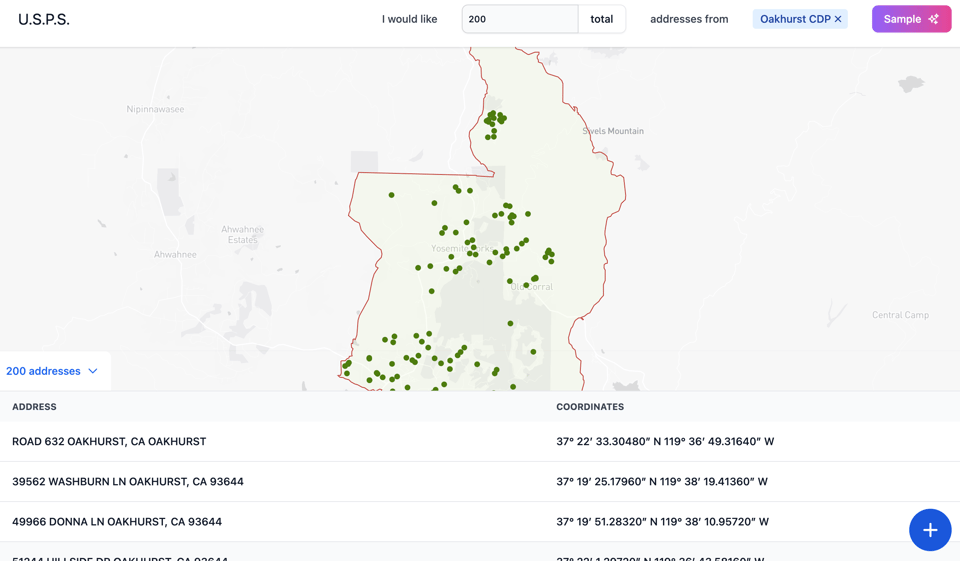
US Place Sampler
A pretty helpful tool: "Use USPS to sample a finite number or percentage of addresses from census areas like counties, tracts, block groups, or other custom shapes from across the United States."
I thought: "oh, great, I'm going to replicate this for the UK". Then I remembered the licensing of PAF and started crying.
https://s2.washingtonpost.com/camp-rw/?trackId=627e24439f177f157dc0af12&s=6484896943b95c37949efd31&linknum=5&linktot=66
Introducing Daft: A High-Performance Distributed Dataframe Library for Multimodal Data
TL;DR: "Daft is a distributed dataframe library that brings familiarity to developers already acquainted with pandas or polars."
It's open source, and offers some pretty good features.

🤯 Data thinking
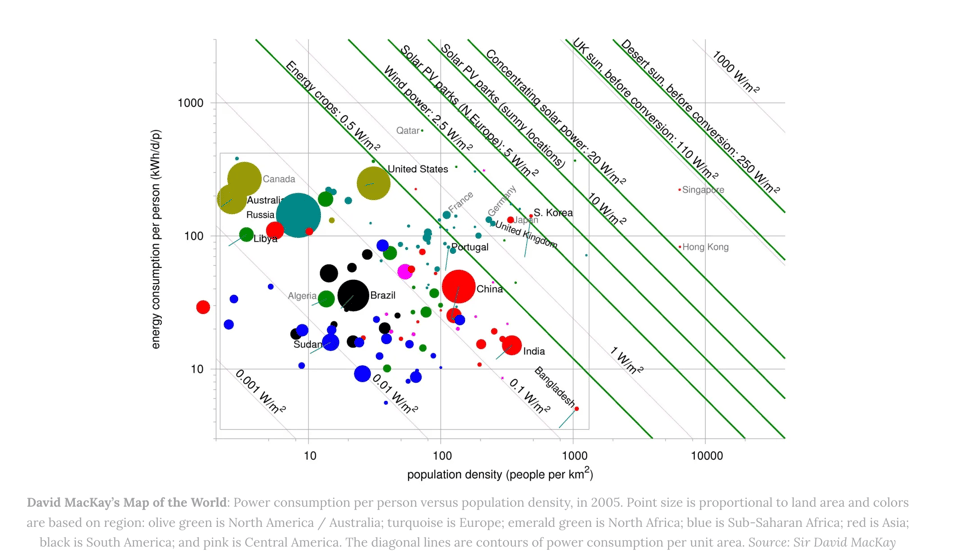
Defying Chart Design Rules for Clearer Data Insights
Satya Amaran for Nightingale: "It turns out that not only is the graphic redeemable but there is a great thought that has gone into it with excellent explanations for each one of these design choices that will become apparent below."
A critique of David MacKay's Map of the World.
Humans are biased. Generative AI is even worse.
Bloomberg: "Stable Diffusion’s text-to-image model amplifies stereotypes about race and gender — here’s why that matters."
📈Dataviz, Data Analysis, & Interactive
DataJockey
Data scientist George McIntire, also known as Jaage when working as a DJ launched this passion project to combine his two jobs. He says: "This project applies my data science expertise towards analyzing my collection of songs. With machine learning's increasing ability to process, synthesize, and even generate music, I became inspired to dive in and see if big data algorithms could help me better understand my musical oeuvre and perhaps optimize my routine DJ activities".

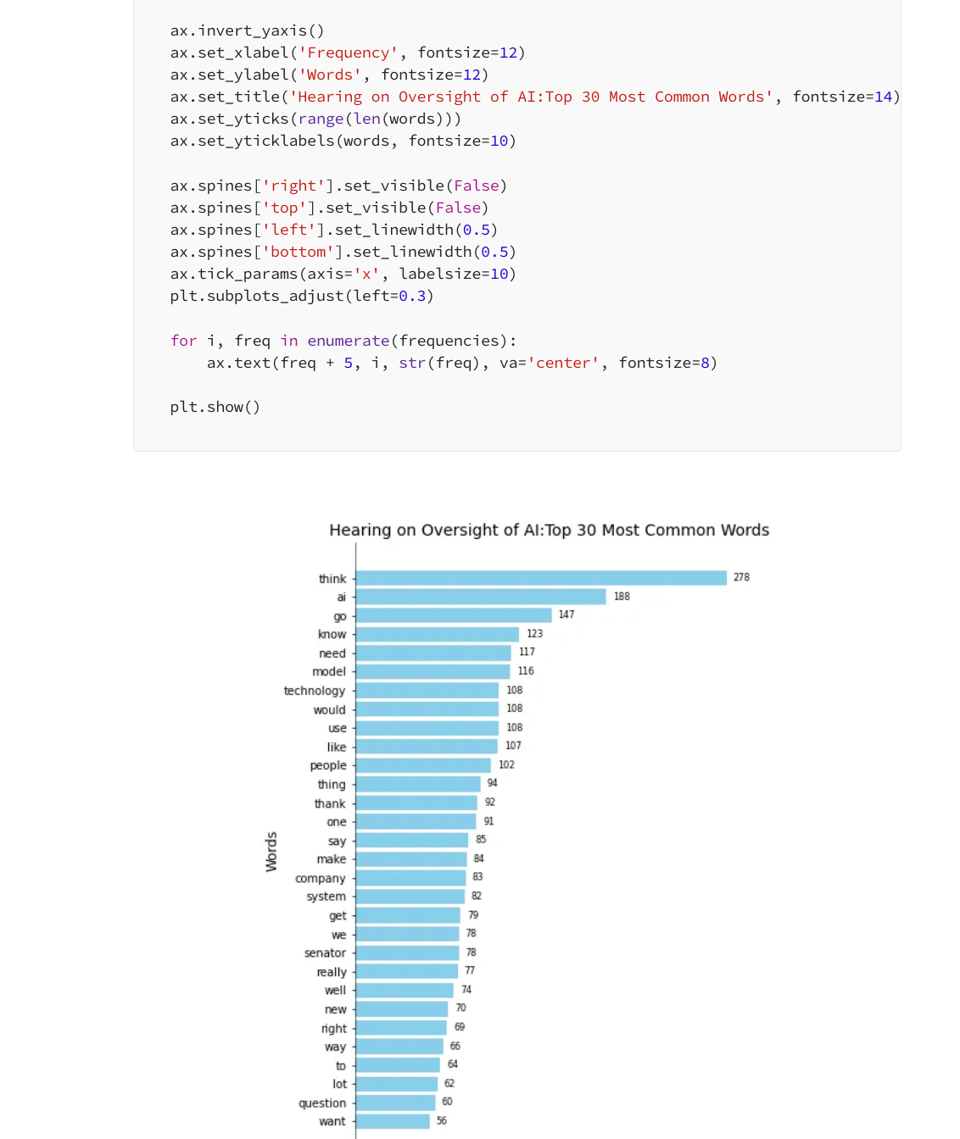
Decoding the US Senate Hearing on Oversight of AI: NLP Analysis in Python
"Word frequency analysis, visualization and sentiment scores using the NLTK toolkit".
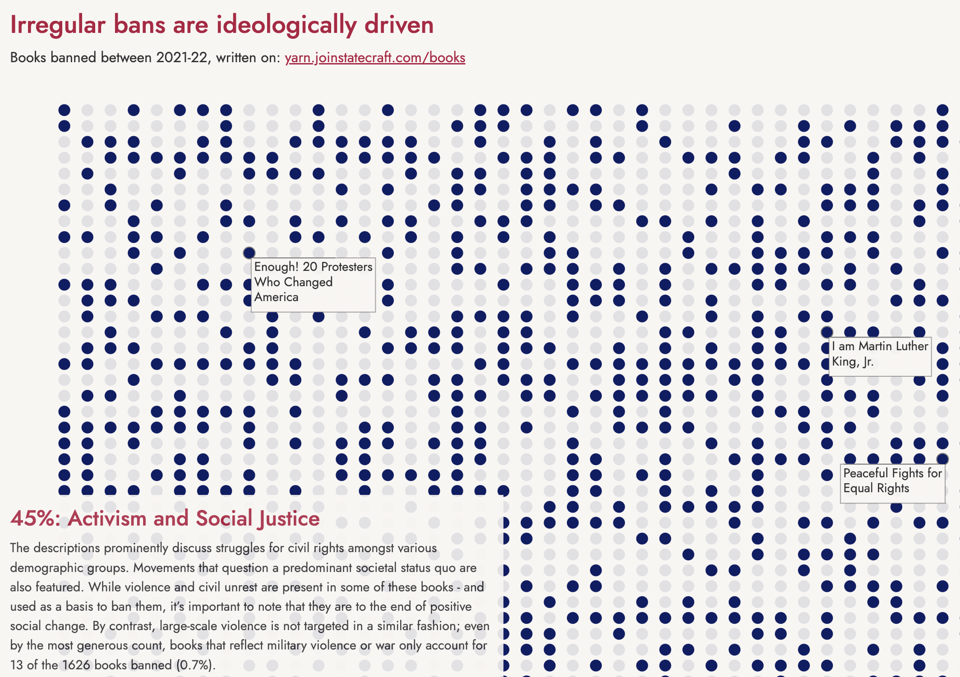
1,626 Books Were Banned in America Last Year...We Reviewed All of Them
"The non-profits PEN America and the American Library Association keep a catalog of banned books in the United States up to the 2021-22 academic year. In this 1 academic year alone, 1600+ books were irregularly banned from 138 school districts across America; 3.8 million students have lost access to information in varying degrees as a result. We've expanded the catalog of banned books by scraping open source data from publishers to give us the clearest possible look at common features of these 1,626 irregularly banned books."
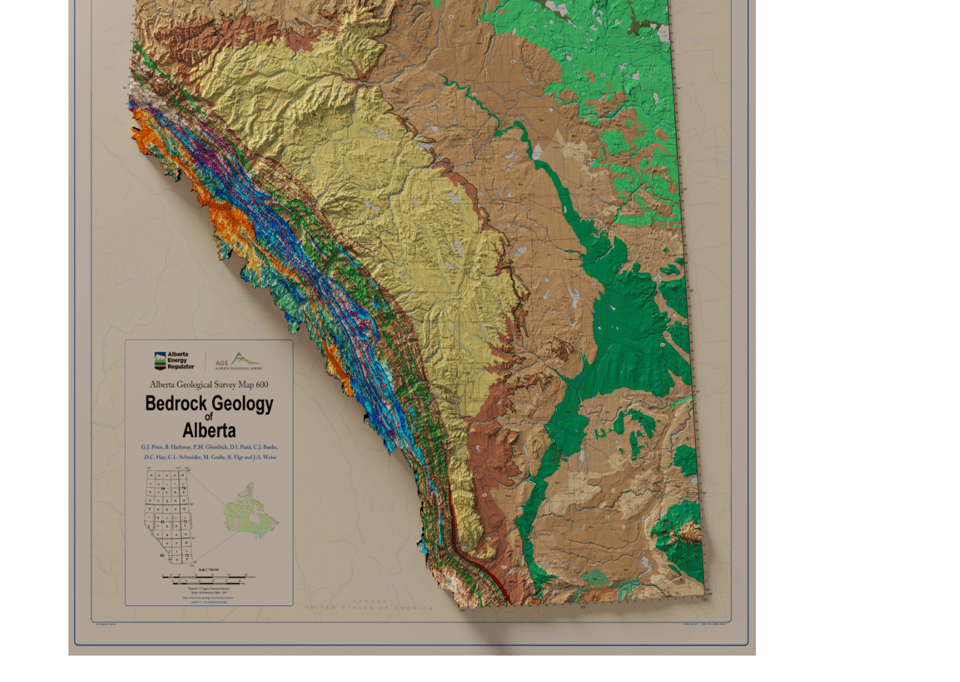
How to Make a 3D Map in Blender
Wesley Barr has written this Blender/GIS Tutorial: "By the end of this article you will understand how to:
Modify GIS data so it is suitable for Blender
Create a 3D surface from elevation data in Blender
Drape a map over the 3D surface
Render a 3D map with realistic lighting."
(h/t Alex Wrottesley)
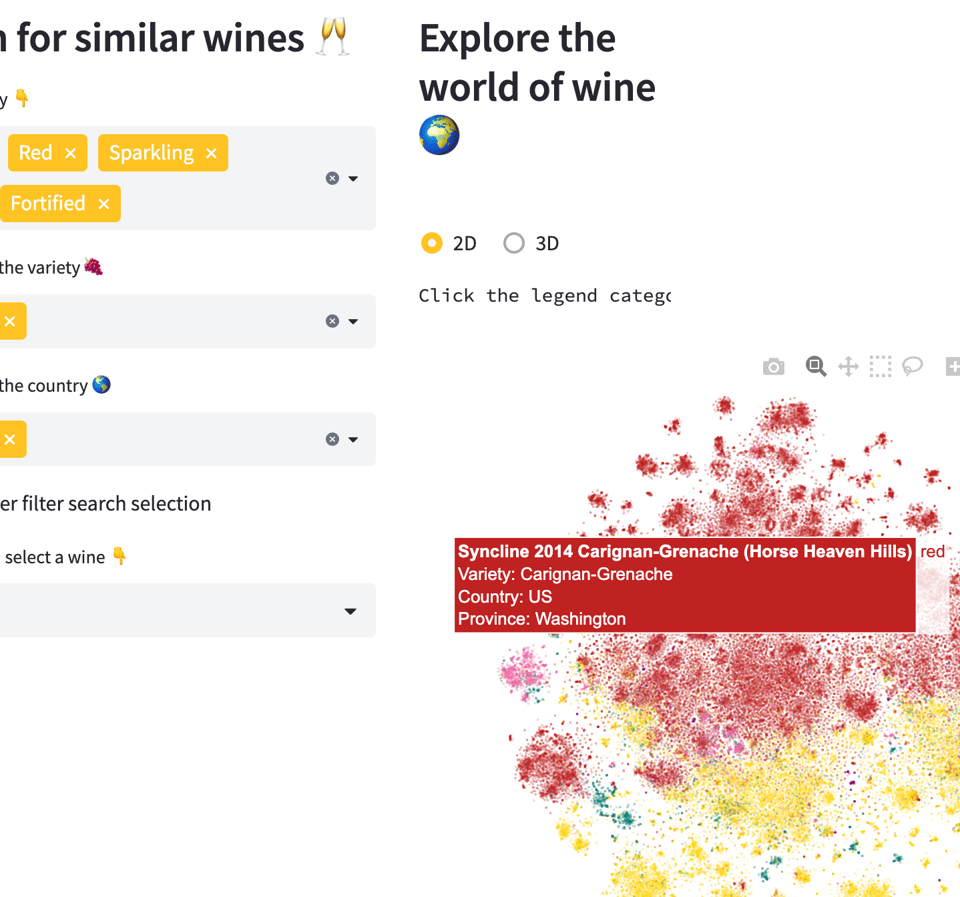
Sommeli-AI
Using AI to explore wine on Hugging Face.
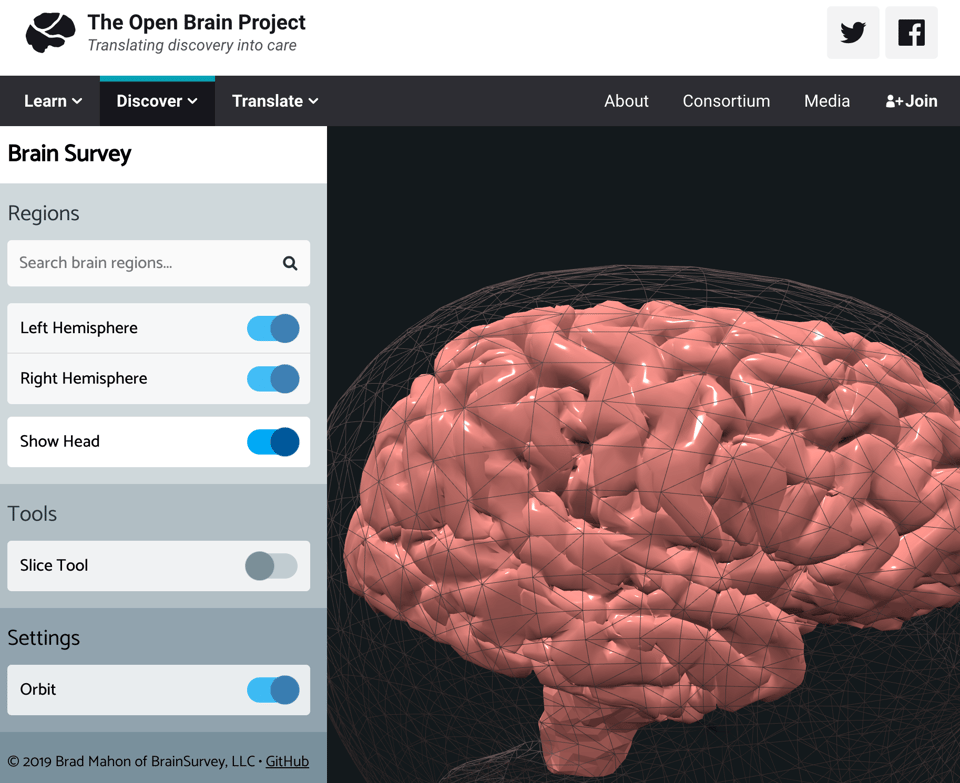
The Open Brain Project Brain Survey
A tool to explore brain regions in 3D.
Longest Lines of Sight
"As far as I know the longest ground to ground line of sight that has ever been photographed in the US lower 48 is to San Gorgonio Mountain, 190 miles or 306 kilometers from Mount Whitney, California. ..."
(h/t Edward Jones)
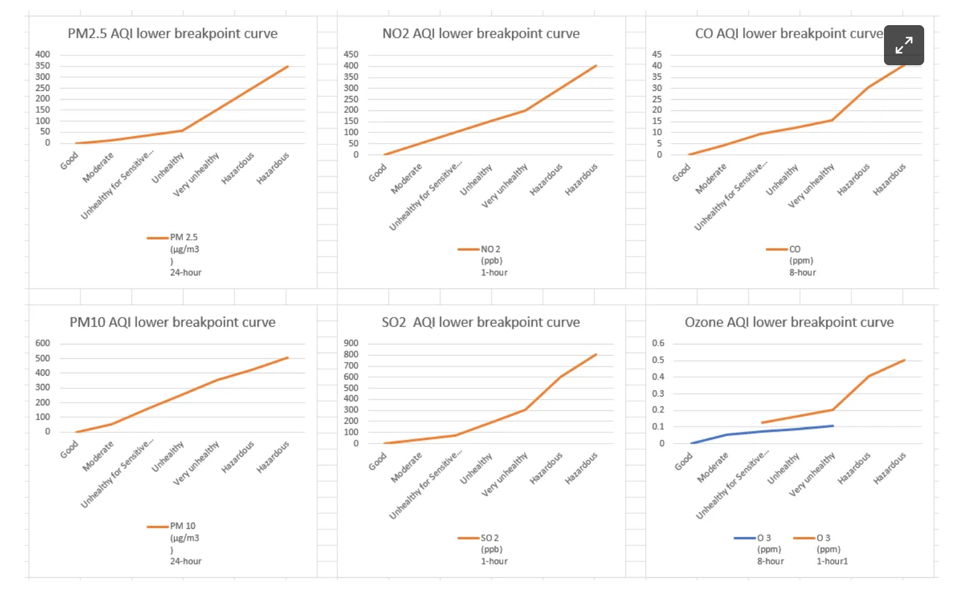
How does the Air Quality Index work anyways?
Randy Au explains how the AQI works.
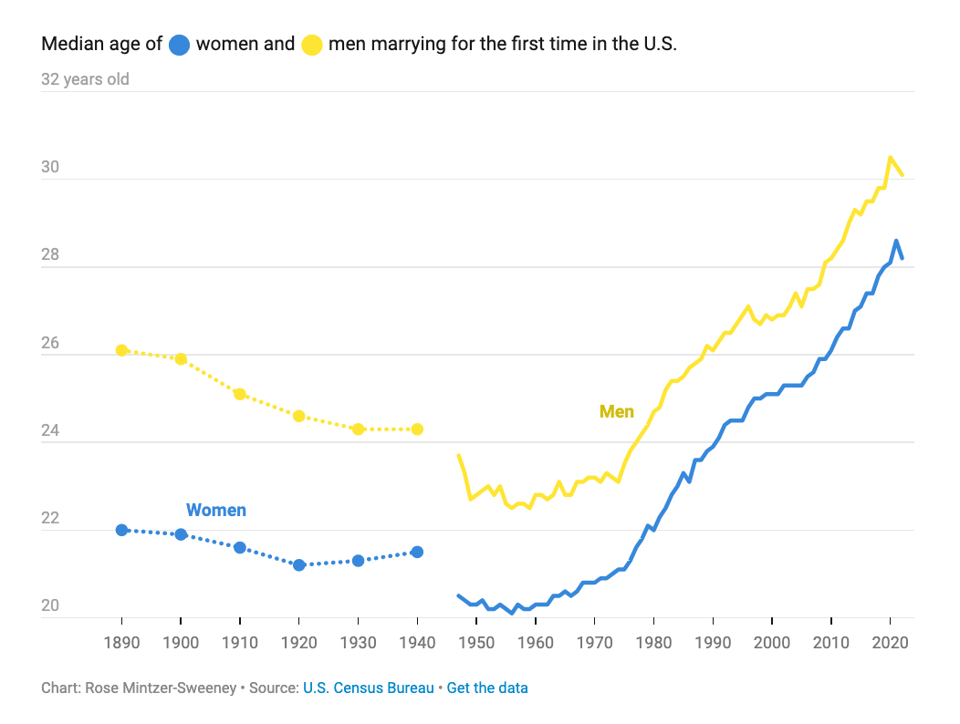
British marriage, zoomed out
Datawrapper's Rose Mintzer-Sweeney expands on the previous week's intriguing look at marriage and homeownership data.
Fruit of the algorithm: Generative fabric design
Rory Gianni writes on his adventures using d3.js to create fabric designs computationally. Code is available.
"The fabric pattern was composed with the help of a generative design tool. It randomly selected and arranged images from the US Dept. of Agriculture's Pomological Watercolour collection to visualise hundreds (if not thousands and thousands) of different shirt designs."

NYC Taxi Trips
Taxi trip visualization that uses Kepler.gl.
"The yellow and green taxi trip records include fields capturing pick-up and drop-off dates/times, pick-up and drop-off locations, trip distances, itemized fares, rate types, payment types, and driver-reported passenger counts. Data is downloaded from NYC Taxi and Limousine Commission (TLC)."

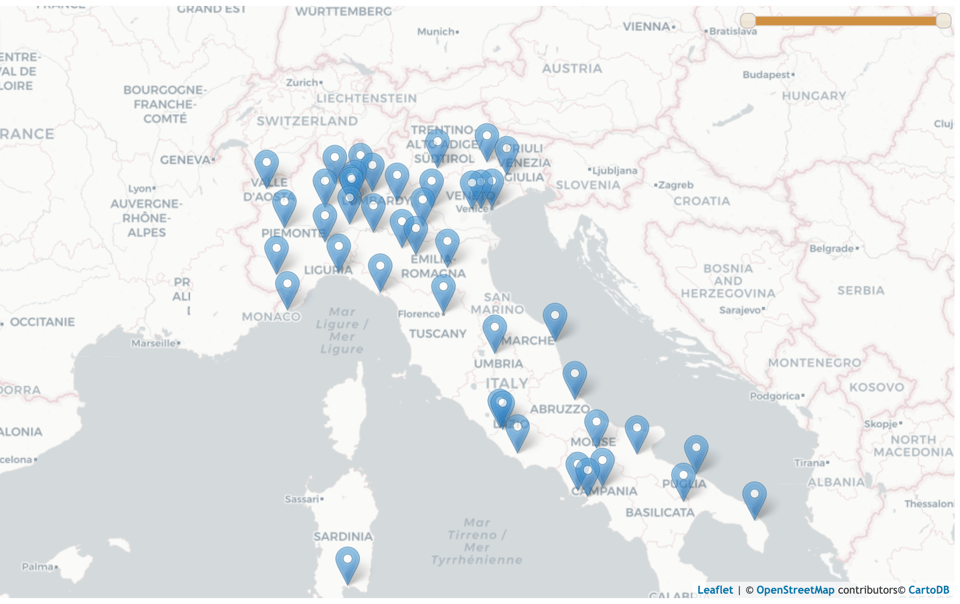
Italy Pride 2023
Alessandro Luollin has created this time-series map of Italy Pride parades using the LeafletJS Slider plugin.
🤖 AI
What children can learn about artificial intelligence
Dale Lane gives one of his legendary talks, focussed on the lessons he's given in AI/ML in school, using an extension of children's programming language scratch. "The focus of the talk was how I’ve seen children understand and react to machine learning technologies."
Generative AI for social good applications
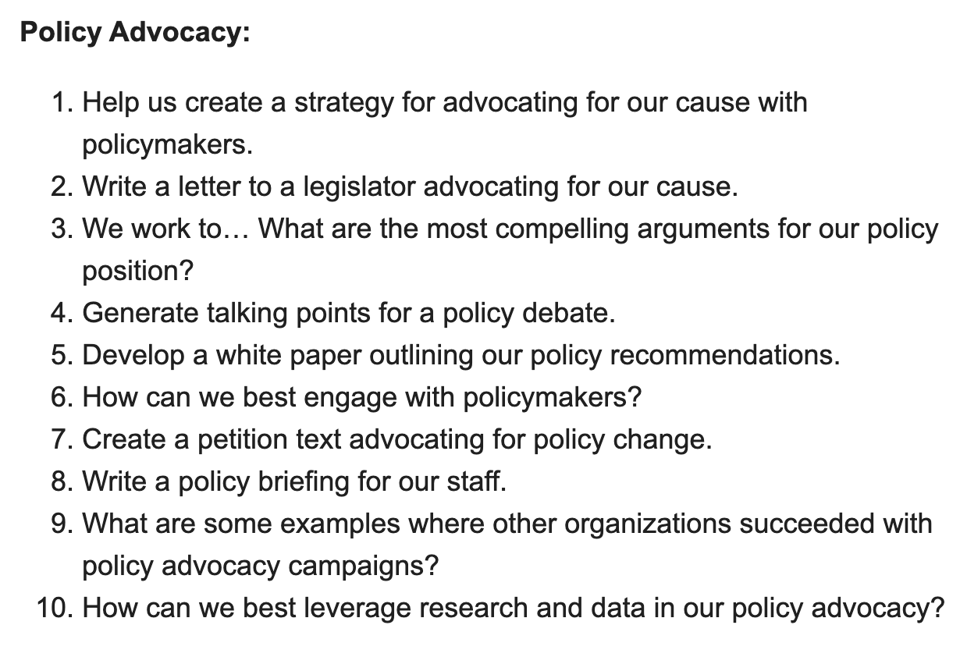
The latest issue of the civictech.guide newsletter has a chunky list of prompts, split between fundraising, campaigning, public engagement, policy advocacy, volunteer management, communications, research and data analysis, member and partner relations, leadership and governance, capacity building and training, and more.
quantum of sollazzo is supported by Andy Redwood’s proofreading – if you need high-quality copy editing or proofreading, check out Proof Red. Oh, and he also makes motion graphics animations about climate change.

Supporters* Alex Trouteaud casperdcl / iterative.ai Naomi Penfold
[*] this is for all $5+/months Github sponsors. If you are one of those and don't appear here, please e-mail me