519: quantum of sollazzo
#519: quantum of sollazzo – 30 May 2023
The data newsletter by @puntofisso.

Hello, regular readers and welcome new ones :) This is Quantum of Sollazzo, the newsletter about all things data. I am Giuseppe Sollazzo, or @puntofisso. I've been sending this newsletter since 2012 to be a summary of all the articles with or about data that captured my attention over the previous week. The newsletter is and will always (well, for as long as I can keep going!) be free, but you're welcome to become a friend via the links below.
Sorry for the delay in sending this one. I had edited and scheduled it, then ... forgotten to click the "send button".
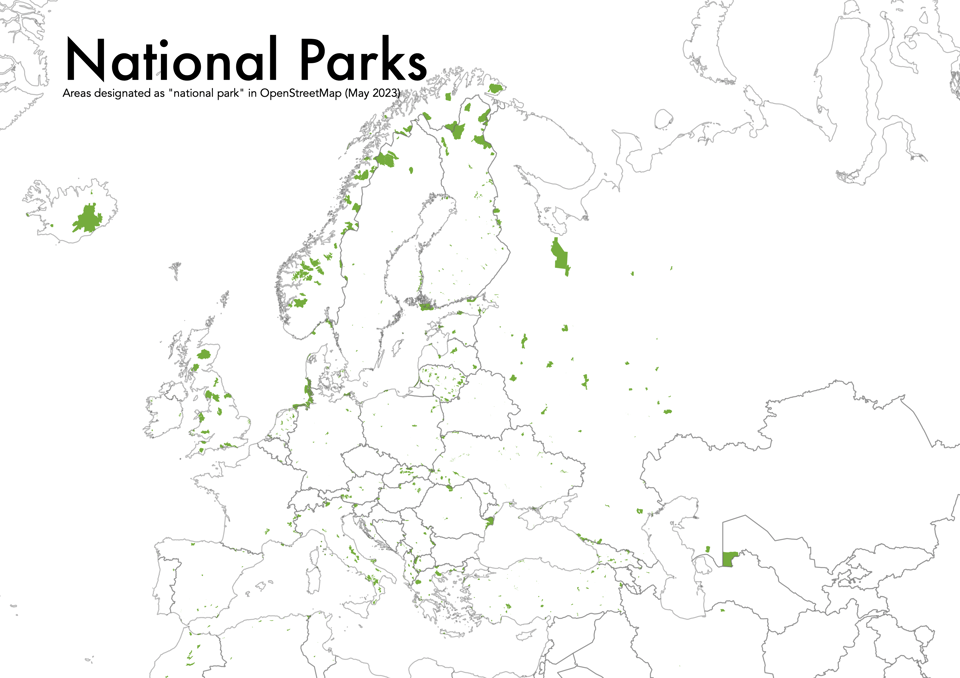
I created a map of National Parks and Protected Areas in OpenStreetMap using QGIS and QuickOSM.
Share it on Mastodon Share it on Twitter
The most clicked link last week was the Washington Post's take on which jobs will be the most impacted by AI.
'till next week,
Giuseppe @puntofisso
|
DO YOU LIKE QUANTUM OF SOLLAZZO? BECOME A SUPPORTER! :) → If you enjoy this newsletter, you can support it by becoming a GitHub Sponsor. Or you can Buy Me a Coffee. I'll send you an Open Data Rottweiler sticker. You're receiving this email because you subscribed to Quantum of Sollazzo, a weekly newsletter covering all things data, written by Giuseppe Sollazzo (@puntofisso). If you have a product or service to promote and want to support this newsletter, you can sponsor an issue. |
✨ Topical
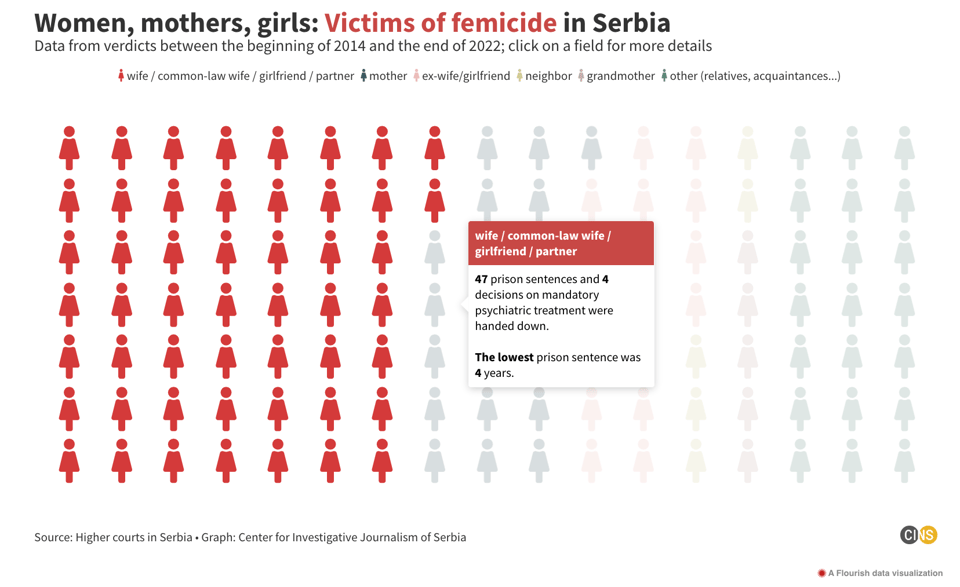
Femicide in Serbia: Crime and Lesser Punishments
"Over the past ten years, more than 300 femicides have occurred in Serbia. Many of those who kill women also commit suicide. The remaining families of the murdered persons look for justice in court, but CINS’s investigation reveals that they often do not find it there."
Teodora Ćurčić, Jovana Tomić for CINS/European Data Journalism Network look at data on femicide in Serbia – and lack thereof.
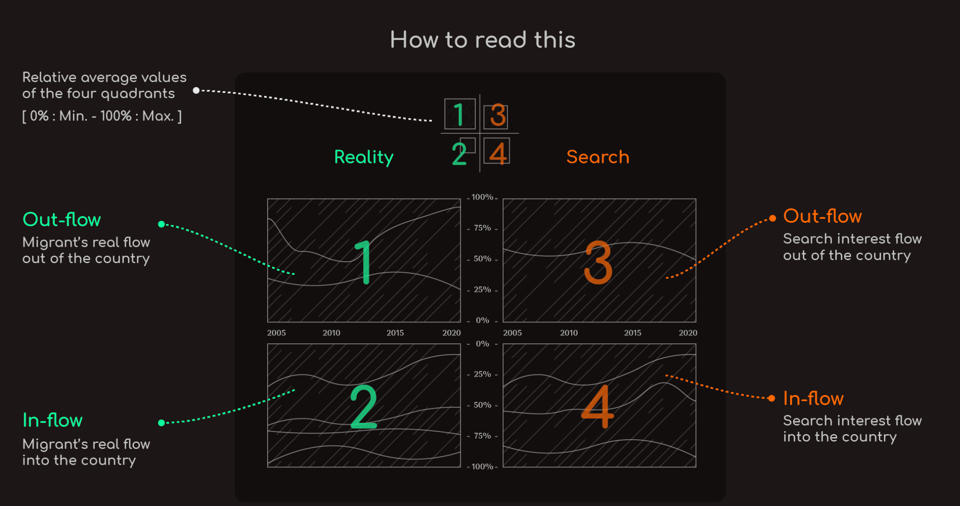
Migration between search & reality
"A visual exploration of the gap between the reality of the world's migrants and search interest."
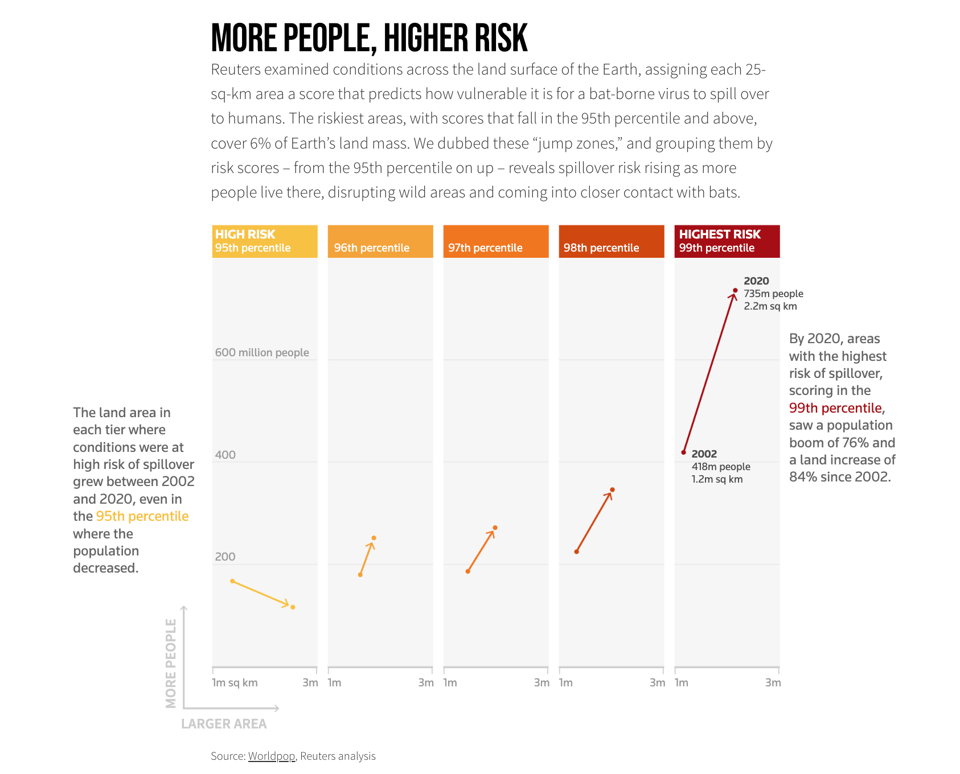
The world's bat lands are under attack...
"...seeding risk of a new pandemic. Here's why."
The brilliant chart below was also analysed by the Washington Post's "How To Read This Chart" column.
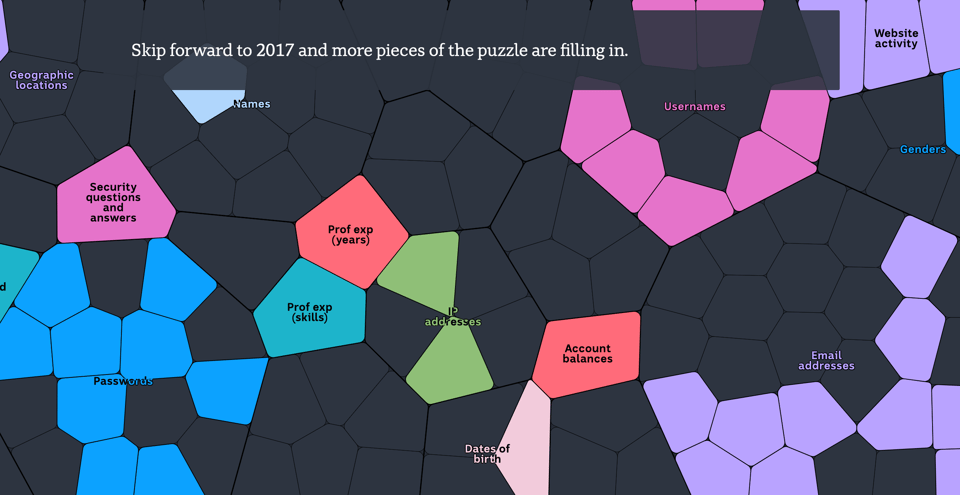
See your identity pieced together from stolen data
"Have you ever wondered how much of your personal information is available online? Here’s your chance to find out."
Interactive, data-driven (data from Have I Been Pwned), and juicy. By the Australian ABC.
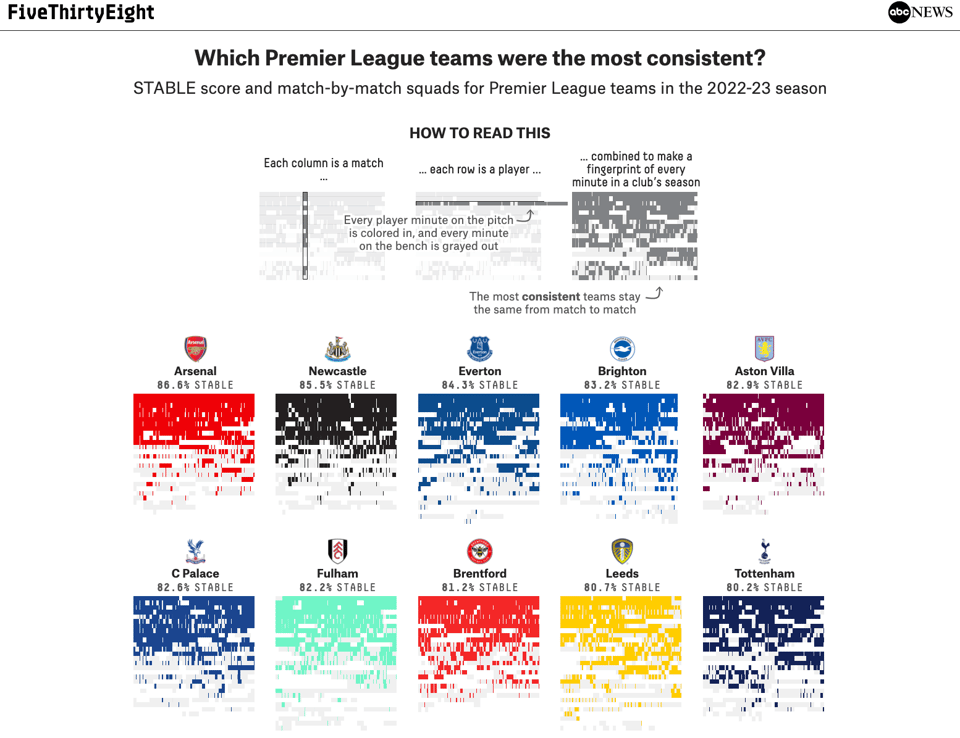
How Consistent Was Every Premier League Lineup This Season?
"What our newest metric STABLE can tell us about Arsenal’s surprising title challenge and Chelsea’s face-plant."
Some pretty ciool interactive dataviz in this take by FiveThirtyEight.
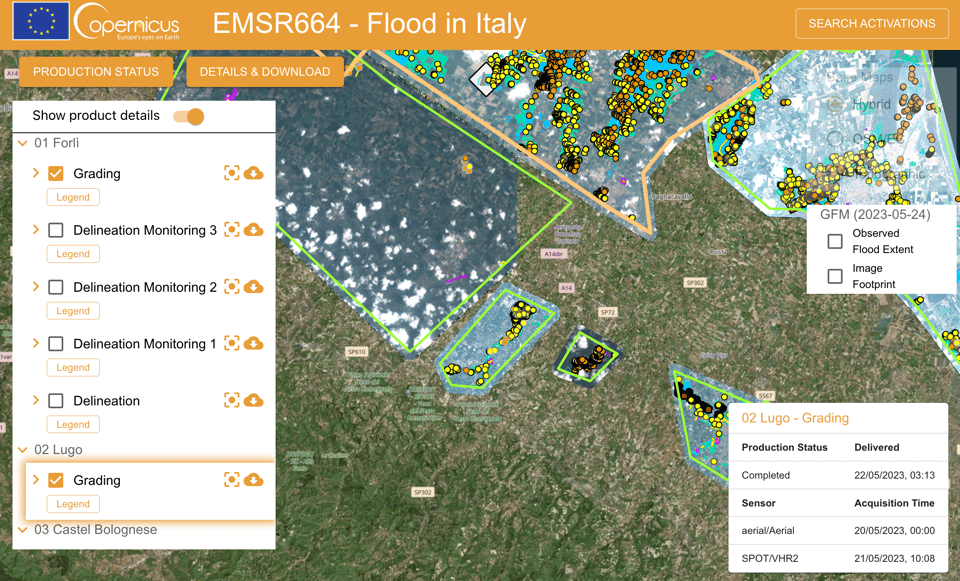
Flooding in Emilia-Romagna
The situation in Emilia-Romagna is rather tragic at the moment, with area of a radius of over 50km suffering from heavy flooding and landslides that followed a bout of extreme weather.
There is interesting data available to follow the unfolding of this crisis. The EU's earth observation Copernicus platform is mapping the floods rapidly, while the Italian National Statistics organisation is sharing detailed data through their GIS portal (sadly, Italian only). Future crisis will see increasingly the use of real-time data like this.
🛠️📖 Tools & Tutorials
Introduction to Data Visualization for the Web
"This is a selection of core course content for INFO474: Introduction to Data Visualization for the Web, a project based course I taught during 2021 and 2022 at the University of Washington."
By academic Colin Megill.
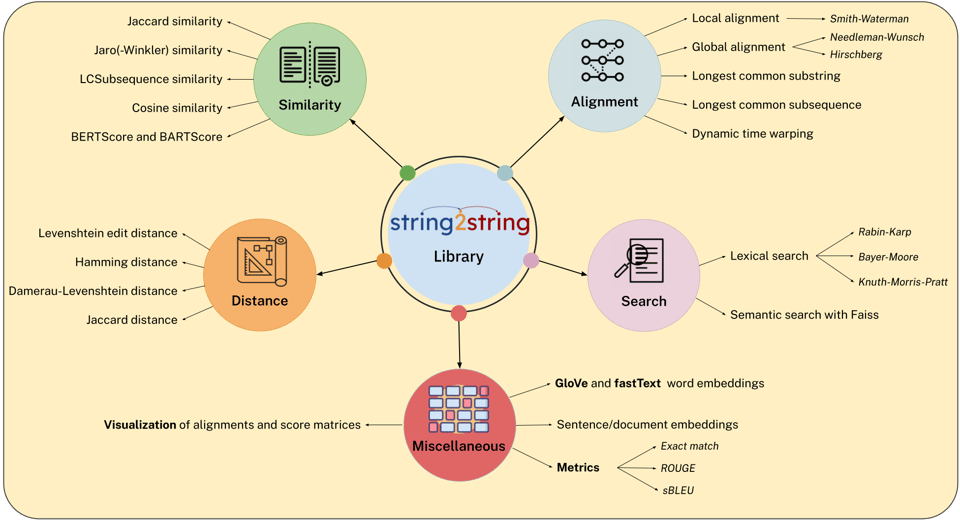
string2string
Developed by researches at Stanford University, the "string2string library is an open-source tool that offers a comprehensive suite of efficient algorithms for a broad range of string-to-string problems. It includes both traditional algorithmic solutions and recent advanced neural approaches to address various problems in pairwise string alignment, distance measurement, lexical and semantic search, and similarity analysis. Additionally, the library provides several helpful visualization tools and metrics to facilitate the interpretation and analysis of these methods."
OpenLLaMA: An Open Reproduction of LLaMA
"TL;DR: we are releasing our public preview of OpenLLaMA, a permissively licensed open source reproduction of Meta AI’s LLaMA 7B trained on the RedPajama dataset."
The performances are really interesting and reignite the debate on open solutions.
Understanding database Indexes in PostgreSQL
"A deep dive into indexes".
Indices, indices!
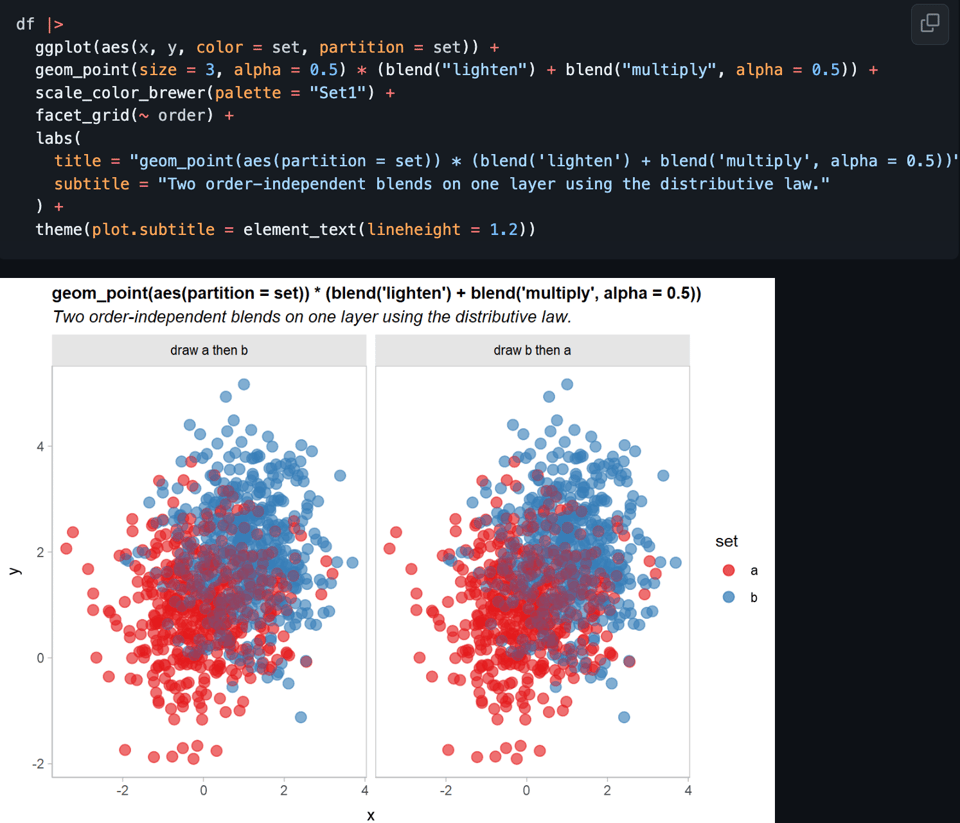
ggblend: Blending and compositing algebra for ggplot2
"ggblend is a small algebra of operations for blending, copying, adjusting, and compositing layers in ggplot2. It allows you to easily copy and adjust the aesthetics or parameters of an existing layer, to partition a layer into multiple pieces for re-composition, and to combine layers (or partitions of layers) using blend modes (like "multiply", "overlay", etc)."
Using linear() for better animation
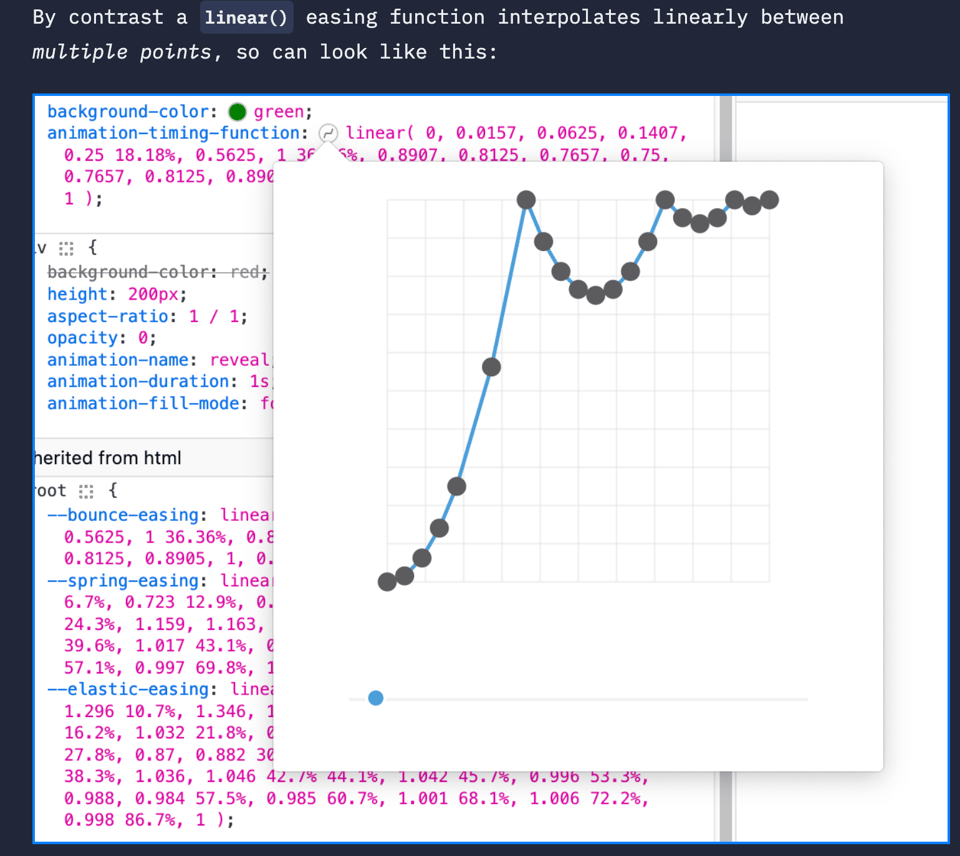
Another useful element of CSS for your animated dataviz: "When working with a @keyframes CSS animation, a CSS transition, or the Web Animations API in Javascript, we’ve long been able to specify an easing as either a cubic bezier, a keyword like ease-in, or a step function."
This article looks at the linear easying function, which is important because: "The linear() function allows us to achieve bounce, spring, and elastic effects that were previously only possible with complex JavaScript."
Panolens.js
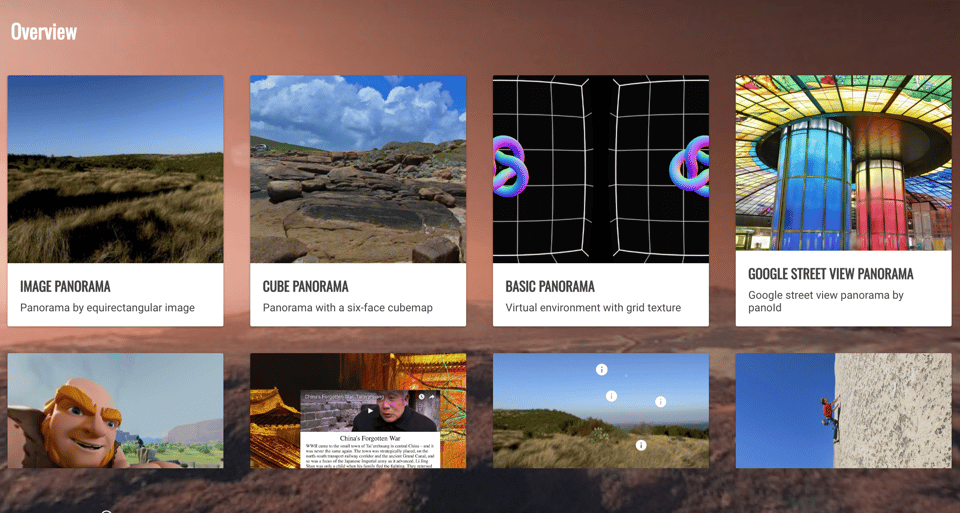
"A javascript panorama viewer".
This video shows how Panolens was used to simulate Renaissance-time Venice.
🤯 Data thinking
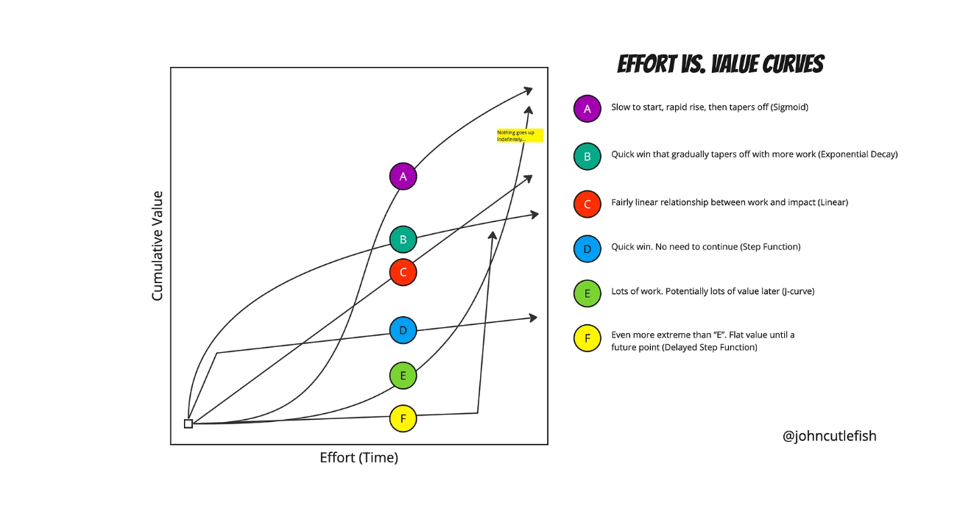
The real liability of data at scale
"... is communication. Also: designing a portfolio based on effort vs value and preparing for your most important business meeting."
📈Dataviz, Data Analysis, & Interactive
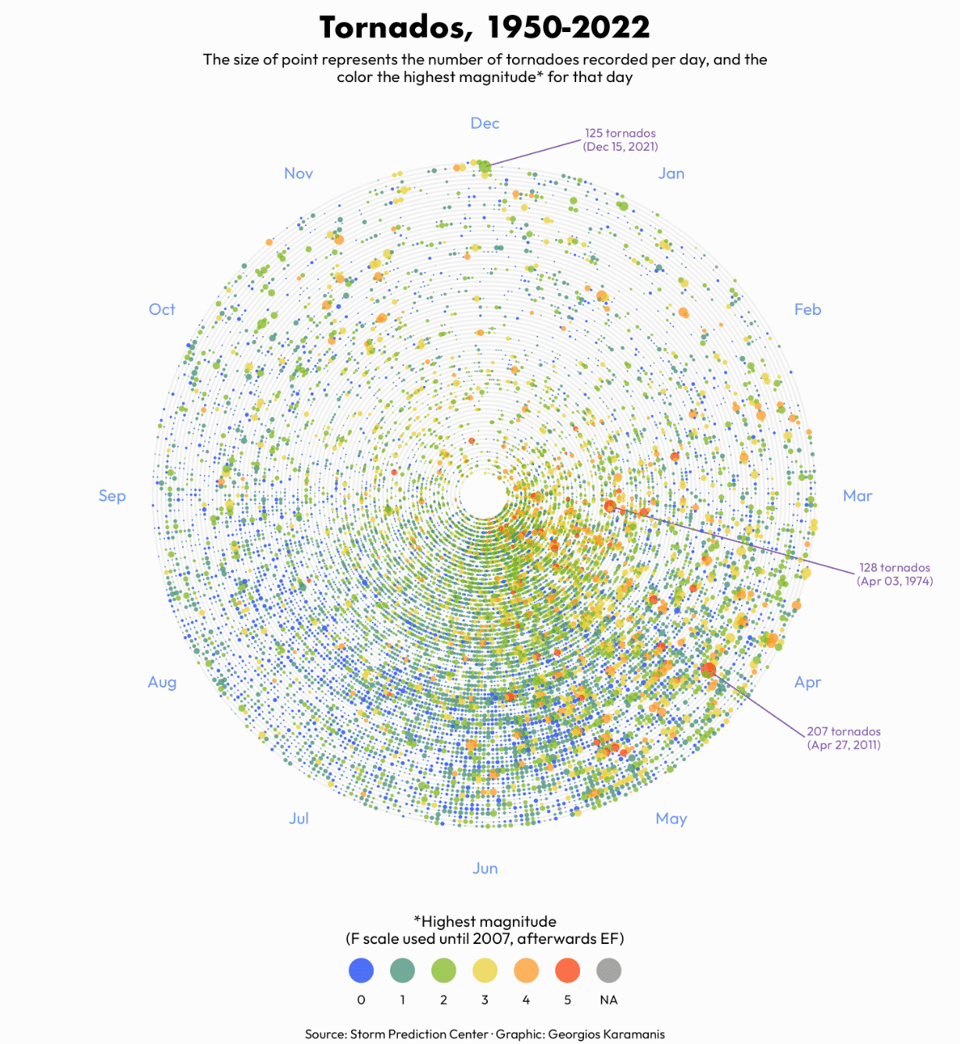
Tornados, 1950-2022
Seen in this tweet by Georgios Karamanis, who's also sharing the R source code.
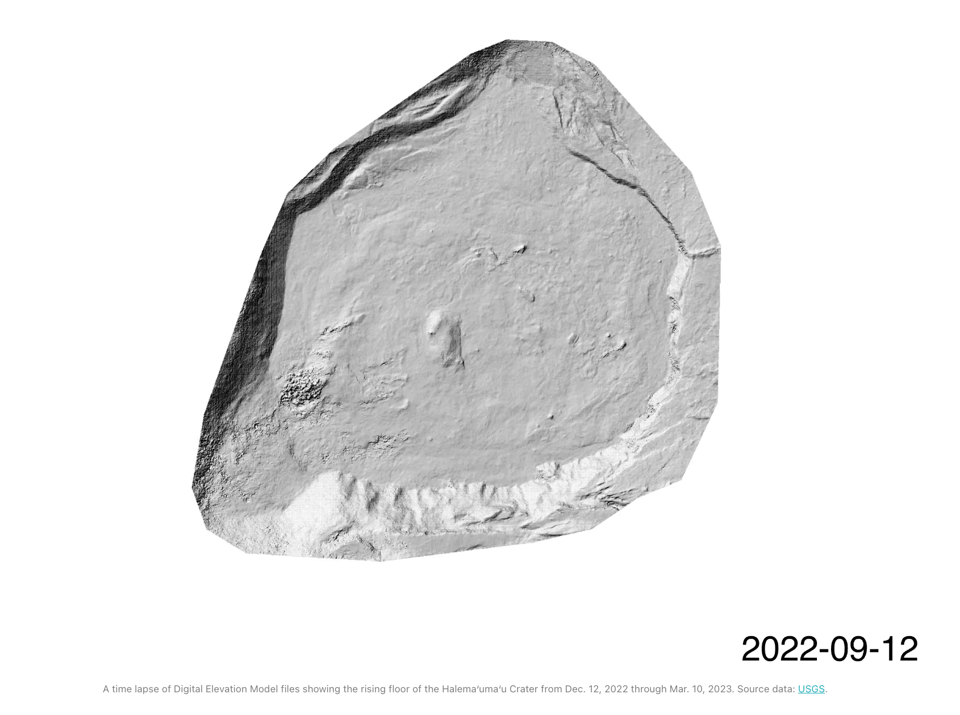
Mapping Volcano Eruptions With Drones
"Drones have become an essential tool to map, measure and observe the extremely dangerous environments surrounding volcanic eruptions."
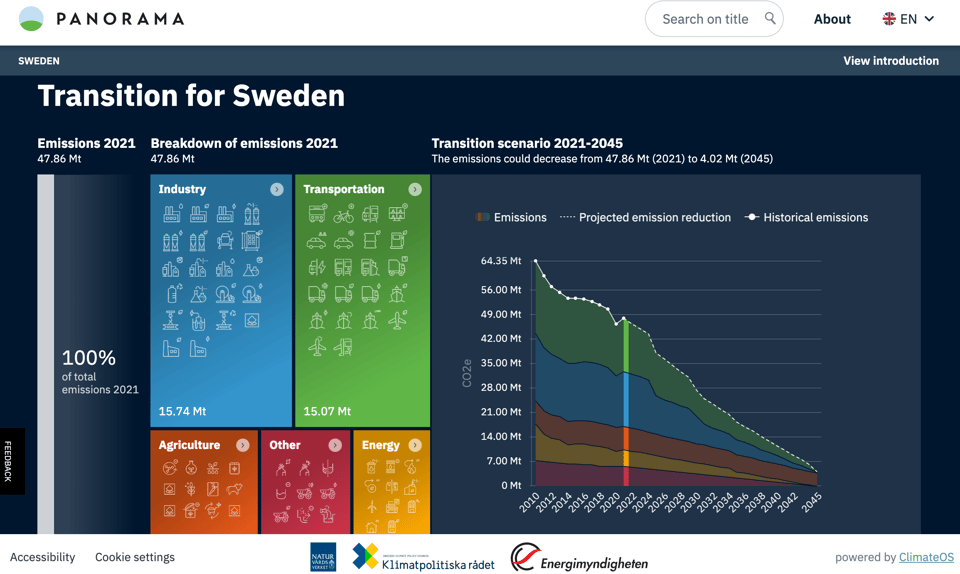
A pathway to Sweden's climate goals
"In Panorama, you can track Sweden’s emissions and the transitions that can minimise them. Explore our platform, the result of government agency collaboration, and see how we can reach the 2045 zero-emissions target, together."
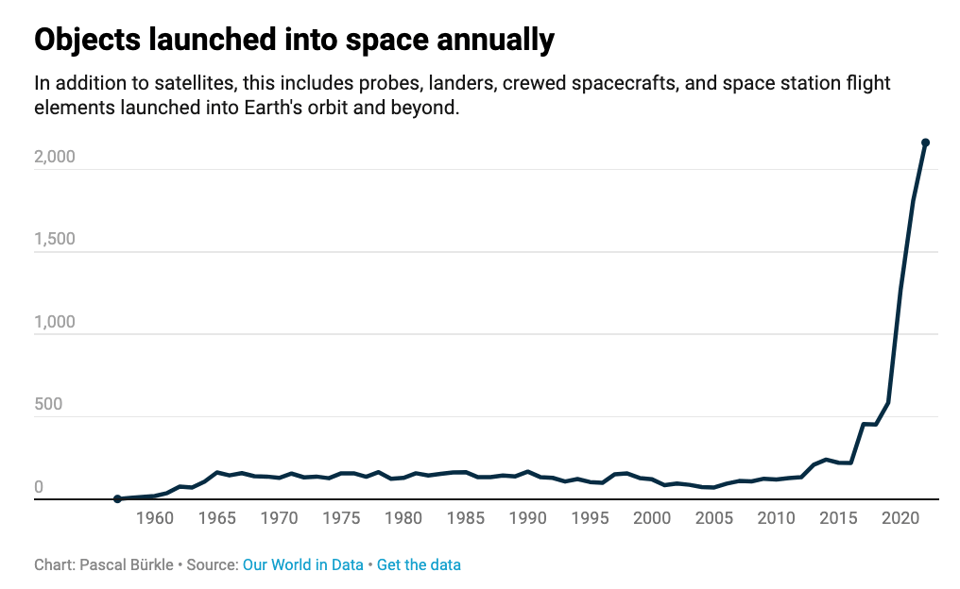
The minefield in Earth’s orbit
Datawrapper's Pascal Bürkle: "In the last 8 years, humans have launched more objects into space than in the 58 years since the launch of the first satellite “Sputnik 1” combined."
How many of these are tracked?
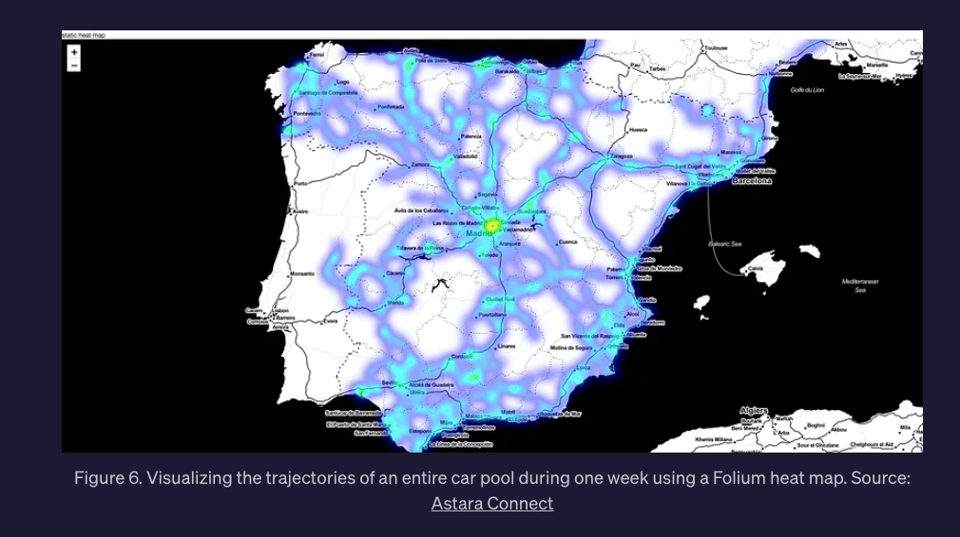
Exploring the dynamics of mobility through the power of heat maps & python
"At Astara Connect we deal with millions of data points per month related to our tracking assets (cars, vans, bikes, and any other type of vehicle)."
A use case, with code provided.
Histomap of Magic the Gathering
A pretty cool data visualization and an explainer from its creator.

ICLR 2023 Workshop: Tackling Climate Change with Machine Learning
"Climate change disproportionally affects people and environments in low- and middle-income countries. For this iteration of the workshop, we aim to explore the connection between global perspectives and local challenges in the context of employing machine learning to tackle climate change."
A chunky list of papers from a workshop at one of the most important ML conferences.
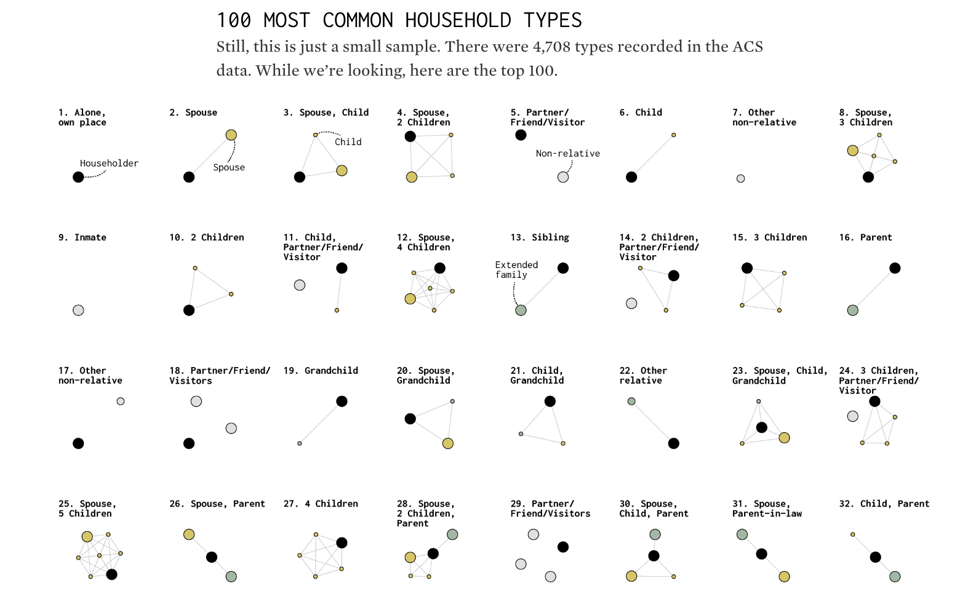
All the Household Types in the U.S.
Flowing Data keeps churning excellent material out of the American Community Survey, a part of their census.
🤖 AI
quantum of sollazzo is supported by ProofRed's excellent proofreading. If you need high-quality copy editing or proofreading, head to http://proofred.co.uk. Oh, they also make really good explainer videos.

Supporters* Alex Trouteaud casperdcl / iterative.ai Naomi Penfold
[*] this is for all $5+/months Github sponsors. If you are one of those and don't appear here, please e-mail me