503: quantum of sollazzo
#503: quantum of sollazzo – 2022
The data newsletter by @puntofisso.

Hello, regular readers and welcome new ones :) This is Quantum of Sollazzo, the newsletter about all things data. I am Giuseppe Sollazzo, or @puntofisso. I’ve been sending this newsletter since 2012 to be a summary of all the articles with or about data that captured my attention over the previous week. The newsletter is and will always (well, for as long as I can keep going!) be free, but you’re welcome to become a friend via the links below.
We have more sponsored content by Ed Freyfogle, organiser of location-based service meetup Geomob, co-host of the Geomob podcast, and co-founder of the OpenCage, who has offered to introduce a set of points around the topic of geodata. His first entry starts a few paragraphs below on building or buying a geocoder.
The most clicked link last week was the mind-boggling visualization of time perception.
‘till next week,
Giuseppe @puntofisso@mastodon.social
|
Become a Friend of Quantum of Sollazzo from $1/month → If you enjoy this newsletter, you can support it by becoming a GitHub Sponsor. Or you can Buy Me a Coffee. I'll send you an Open Data Rottweiler sticker. You're receiving this email because you subscribed to Quantum of Sollazzo, a weekly newsletter covering all things data, written by Giuseppe Sollazzo (@puntofisso). If you have a product or service to promote and want to support this newsletter, you can sponsor an issue. |
✨ Topical
The map of the observable Universe
“…from the Milky Way to the edge of what can be seen”.

A study of lights at night suggests dictators lie about economic growth
“Satellite data hints at the scale of their deception”. A brilliant piece by The Economist, starting with that trope about Mussolini and trains.

EU’s support for Ukraine backed by three-quarters of Europeans
“After almost a year of war with Russia, EU citizens still predominantly support Ukraine and the EU’s approach to the crisis.“

Despite Rain Storms, California Is Still in Drought
“A rapid string of punishing storm systems, known as atmospheric rivers, has brought extreme amounts of rain and snow to California during the past weeks, but the sudden deluge has not made up for years of ongoing drought”, the New York Times reports.

Charted: The NFL’s roller coaster season
I absolutely love these hand-drawn-like charts by Axios.

🛠️📖 Tools & Tutorials
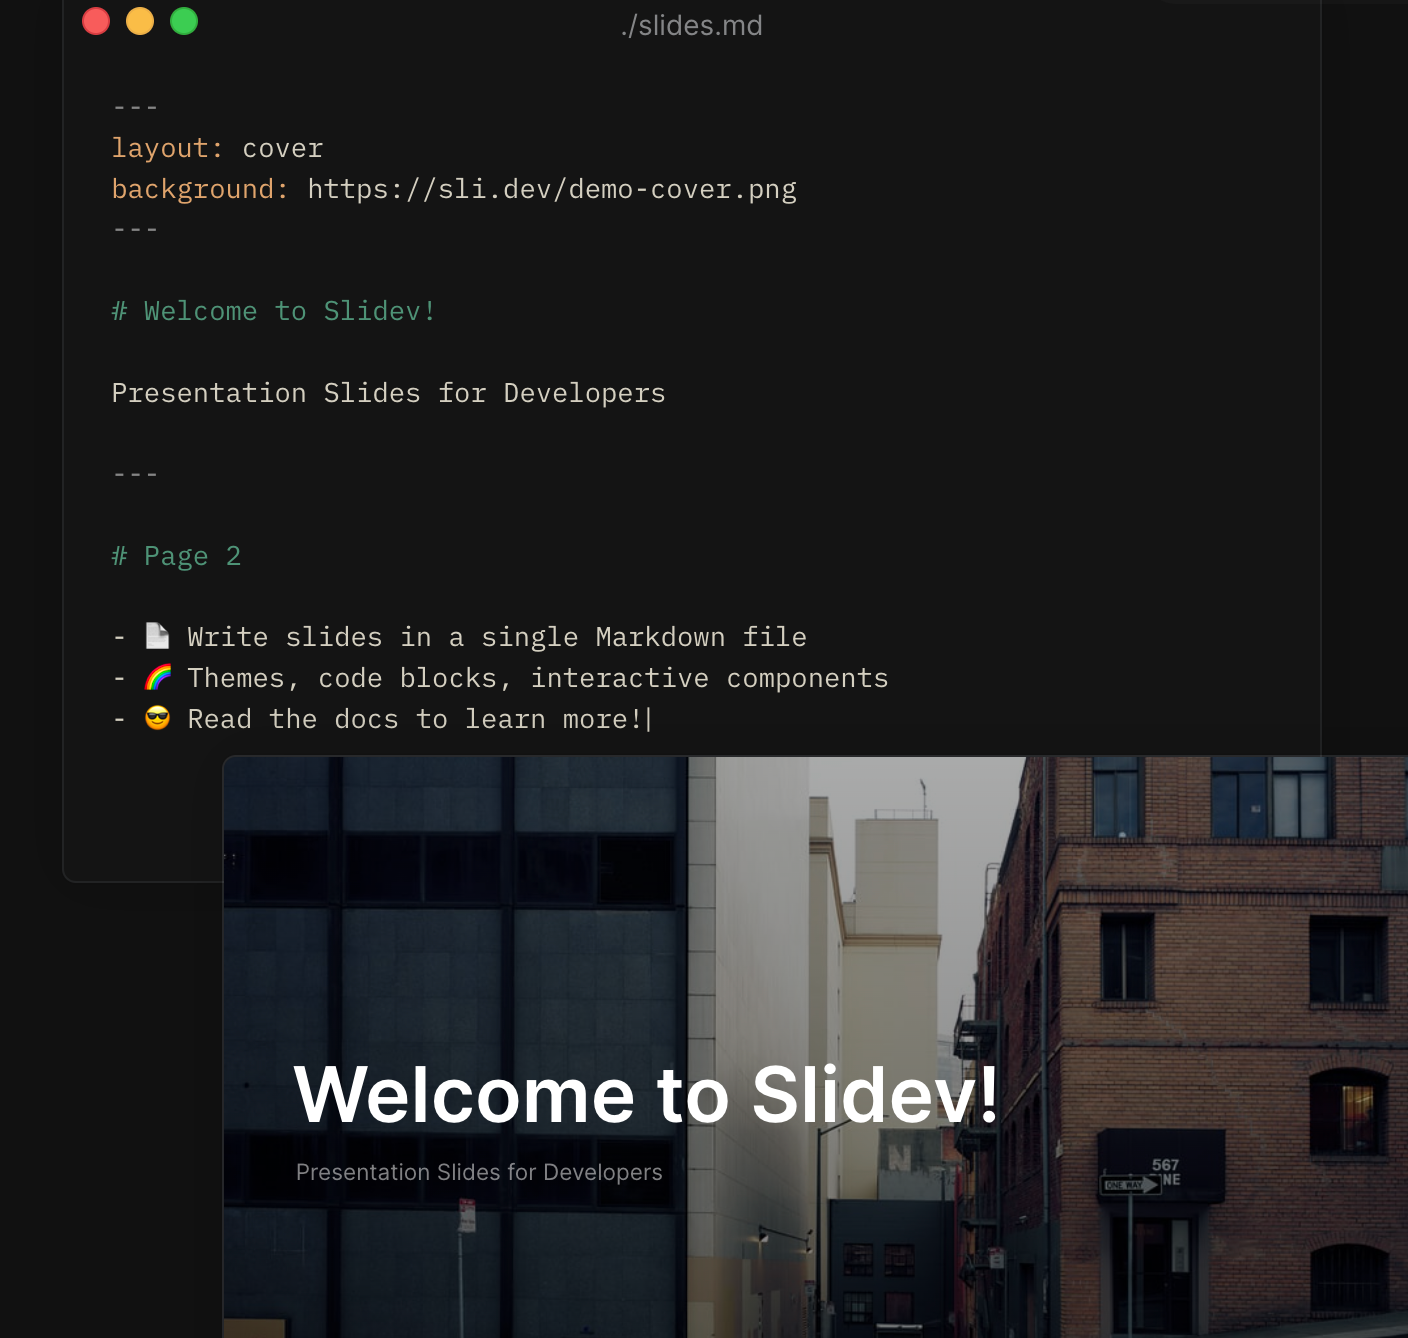
Slidev
MIT-licensed system to create presentation slides, specifically aimed at developers. It uses Markdown.
Frictionless data
“Frictionless is an open-source toolkit that brings simplicity to the data experience - whether you’re wrangling a CSV or engineering complex pipelines.“
It’s supported by the Sloan Foundation and the Open Data Institute.
SSSVG
An “interactive SVG Reference” that will clarify a few SVG concepts.

Iteratively Generating Data Visualization Code with ChatGPT
“I thought it would be really fun to test out ChatGPT’s code generation capabilities - focusing on three primary questions:
Can ChatGPT write ggplot2 code which seems to capture the semantic meaning requested in the prompt?
Does the generated code actually run and build the charts requested?
Can ChatGPT translate code between R and ggplot2 and Python and Seaborn?“

Colours for maps
This Observable notebook is a handy tool that allows you to explore different colouring schemes for your choropleths.

Introducing anywidget
“anywidget is a new Python library that greatly simplifies creating and publishing custom Jupyter Widgets. Unlike the traditional (cookiecutter) approach, with anywidget you 1) avoid fiddling with build steps and bundlers, 2) can prototype widgets from within a notebook, and 3) get a modern front-end developer experience.“

Data science cheatsheets
A set of handwritten notes from a data scientist on general data science, machine learning, statistics, deep learning, image processing, and general data structures and algorithms.
5 Steps to Build Beautiful Bar Charts with Python
“How to use the full capabilities of Matplotlib to tell a more compelling story.“

6 easy ways to map population density in R
Data analyst Milos Popovic explains how to use R to create beautiful maps that show population density.

![]()
Build or Buy? Should you try to create your own geocoder?
Welcome to part four of our series on geocoding.
Given freely available opensource software, and open data like OpenStreetMap, should you run your own geocoder? Or should you pay a service like ours to host the geocoding software for you? The whole point of open data is that you can do it yourself, right?
The short answer is that yes, you can run, or even write, your own geocoder. Unique technical requirements may mean it makes sense to craft your own custom service, but most people prefer to leave it experts and get on with their real work.
Our geocoding API aggregates many different open data sources and provides enterprise level reliability. One factor we see many people overlook: setting up the software is one thing, keeping the underlying data current is another. Put another way: building is easy, maintaining is hard. OSM alone gets 4-5 million edits per day. Still, as a developer myself and long-time OSM contributor, I understand the inclination to get your hands dirty. Hopefully it helps put you at ease to know that we’re doing our part to give back to the open data and open source geo software community.
Finally, rest easy knowing that if you ever need to the data and code is all there for you to dive into. That’s the real power of open-source and open data.
Have a project that will need geocoding? See our geocoding buyer’s guide for an overview of all the factors to consider when choosing between geocoding services.
🤯 Data thinking
Transform Your Data Team into a Performance Powerhouse
“Drive more value for your organization by adopting an action-oriented mindset“
Mechanisms for Effective Machine Learning Projects
ML engineer Eugene Yan: “How can we improve a machine learning project’s chance of success? Over the years, I’ve explored various mechanisms in both my own projects and those of my team members. Most people who tried these mechanisms ended up adopting them in future projects. I’m sharing a few here that I hope will help you in your projects too.
While these mechanisms were developed with machine learning projects in mind, with a few tweaks, they can be applied to other technical endeavors too.“
📈Dataviz, Data Analysis, & Interactive
Text Visualization Browser
“A Visual Survey of Text Visualization Techniques (IEEE PacificVis 2015 short paper)“

Visualizing wind turbines in 3D using threebo
What you can do with Observable in a browser these days is absolutely outstanding.

House Buying Analysis
Yes, another Observable notebook (I received Observable’s newsletter and went on a spree trying their most featured notebooks). I really like the ease of creating stories that are both interactive and customisable in the way they show the results of data analyses.

Blackouts in Ukraine visualised
From this original article in Ukrainian which sadly fails to get automatically translated into English.

Dette, fiscalité : découvrez les villes les plus mal gérées de France
From this tweet, a chart of the worst managed towns in France, based on levels of debt and taxation.

🤖 AI
Transformer models: an introduction and catalog — 2023 Edition
A long list of transformer models, including BERT, DALL-E, GPT, and more.
quantum of sollazzo is supported by ProofRed’s excellent proofreading. If you need high-quality copy editing or proofreading, head to http://proofred.co.uk. Oh, they also make really good explainer videos.

Supporters* casperdcl and iterative.ai Jeff Wilson Fay Simcock Naomi Penfold
[*] this is for all $5+/months Github sponsors. If you are one of those and don’t appear here, please e-mail me