491: quantum of sollazzo
#491: quantum of sollazzo – 8 November 2022
The data newsletter by @puntofisso.

Hello, regular readers and welcome new ones :) This is Quantum of Sollazzo, the newsletter about all things data. I am Giuseppe Sollazzo, or @puntofisso. I’ve been sending this newsletter since 2012 to be a summary of all the articles with or about data that captured my attention over the previous week. The newsletter is and will always (well, for as long as I can keep going!) be free, but you’re welcome to become a friend via the links below.
Let’s meet? I’ll be in Berlin from Thursday 10th (evening) till Monday morning. I’ve got a somewhat packed diary, but if you are about and want to have a data coffee/drink, let me know – it might be possible to squeeze things in :)
The most clicked link last week was the American Opportunity Index.
‘till next week,
Giuseppe @puntofisso
|
Become a Friend of Quantum of Sollazzo from $1 per month → If you enjoy this newsletter, you can support it by becoming a GitHub Sponsor. Or you can Buy Me a Coffee. I'll send you an Open Data Rottweiler sticker. You're receiving this email because you subscribed to Quantum of Sollazzo, a weekly newsletter covering all things data, written by Giuseppe Sollazzo (@puntofisso). If you have a product or service to promote and want to support this newsletter, you can sponsor an issue. |
✨ Topical
Disabled Data
“If we wanted to tell the story of disability through its data we would immediately find ourselves in a condition of disability, prevented from research, collection, analysis and processing due to structural and contextual barriers. What are the structural and contextual barriers that limit access to disability data?“
A great initiative about data access. It comes with some useful data (although the dashboard is in Italian only for now)

30 Day Map Challenge
I hope you’re all following the #30DayMapChallenge hashtag on Twitter. Launched by Topi Tjukanov (featured in quantum issue 425), this is now a yearly event that encourages people to share a map a day in November.
Among the best I’ve seen, the map below was made by Lisa Hornung (she also, featured in quantum 452) using matplotlib and Open Street Map.

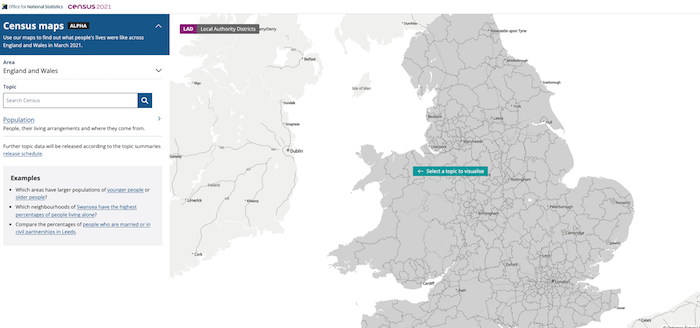
Census maps
A brilliant resource from the ONS about the most recent UK Census (2021), now in Alpha.
How does Labour win a majority?
Although the full article is behind a paywall, this Twitter thread by the Sunday Times’ Tom Calver has all you need to read on the topic.

FiveThirtyEight’s US Election forecasts
Now updated with House, Senate, and Governors elections. They all look good for the Republicans.
(via Gavin’s Warning: Graphic Content)

A key election metric for Democrats is on a sign in your neighborhood
This is a remarkable chart. From this Washington Post article.


Become smarter with this free newsletter: Morning Brew
Life hack: hear about the latest business and tech news before anyone else by reading Morning Brew. Never boring, expect smart and witty reporting that makes consuming the news more enjoyable. Plus, it’s free and takes only five minutes to read.
🛠️📖 Tools & Tutorials
Dashboard Design Patterns
“This page lists design patterns for dashboard design collected to support the design and creative exploration of dashboard design.“

Geotools
Hans Hack has published a set of useful geoprocessing tools which include a reprojector, an area size calculator, and – my favourite – “GeoSentences”, a tool that enacts sentences such as “remove Berlin from Germany” in GeoJSON files.

FEC Itemizer
“Browse Federal Campaign Finance Filings”, another great data wrangling helper by ProPublica.
🤯 Data thinking
Using a data dictionary as your roadmap to quality data
“While a data dictionary, sometimes also called a codebook or variable information log, is often used as a tool to help you and others interpret your data at the end of your project, it is actually even more powerful if created before you ever collect a single piece of data, serving as a roadmap as you design your data collection tools and clean your data, in order to ultimately get to where you want to go.“
The past, present, and future of the semantic layer
Prukalpa Sankar writes about this important bit of data architectures.
📈 Dataviz, Data Analysis, & Interactive
Elon Musk owns Twitter; politicians should leave
“Analysis of 460,501 tweets from U.K. MPs suggests that posting on social media is not very useful for politicos.“
I have to say that I’m not sure I agree 100% with Mr Piccinelli’s conclusions this time (some correlations are suggestive) but… it’s the usual brilliant piece of documented analysis in his bullish style.

Did releasing oil from the Strategic Petroleum Reserve impact gas prices?
“A Treasury Department analysis showed releases from the reserve contributed to a 13 to 31 cent per gallon decrease in the price of gas through July. But prices have risen in recent months.“
A data analysis by USA Facts.

NYC Ridership Recovery
Work in progress by Ben Oldenburg: “an unofficial overview of the post-pandemic recovery of New York City’s transit services with MTA’s Day-by-Day Ridership Numbers.“

When do people watch fireworks around the world?
It varies, according to this Google Trends -powered article from DataWrapper.

🤖 AI
Mapping Wikipedia with BERT and UMAP
“In this explorable, we present […] an interactive map of BERT’s pretrained embeddings of all articles in English Wikipedia. We explain how to use this map as a tool for understanding and discovering relationships in pretrained embeddings.“

quantum of sollazzo is supported by ProofRed’s excellent proofreading. If you need high-quality copy editing or proofreading, head to http://proofred.co.uk. Oh, they also make really good explainer videos.

Sponsors* casperdcl and iterative.ai Jeff Wilson Fay Simcock Naomi Penfold
[*] this is for all $5+/months Github sponsors. If you are one of those and don’t appear here, please e-mail me