440: quantum of sollazzo
#440: quantum of sollazzo – 21 September 2021
The data newsletter by @puntofisso.

Hello, regular readers and welcome new ones :) This is Quantum of Sollazzo, the newsletter about all things data. I am Giuseppe Sollazzo, or @puntofisso. I've been sending this newsletter since 2012 to be a summary of all the articles with or about data that captured my attention over the previous week. The newsletter is and will always (well, for as long as I can keep going!) be free, but you're welcome to become a friend via the links below.
·
Recently I've been looking at the Fitzpatrick Scale, which is a classification of human skin colour. Originally developed in dermatology to describe skin shades, I've been reading about it while researching how to address bias in data for AI applications and coming up with obvious questions, such as "if we need to collect images on which to build a machine learning model, what is the best unbiased distribution of images on the Fitzpatrick Scale?".
In other words, is it best to have an equal number of images per step in the scale (a uniform distribution), or should images be allocated according to some other distribution? And this is assuming that the best approach is to create a single model as opposed to, for example, a separate model per step on the scale. All of this is very abstract, of course, and might be necessary to know the full context of the application in order to really understand what's right to do.
Interestingly, the Fitzpatrick Scale is also the basis for emoji skin modifiers.
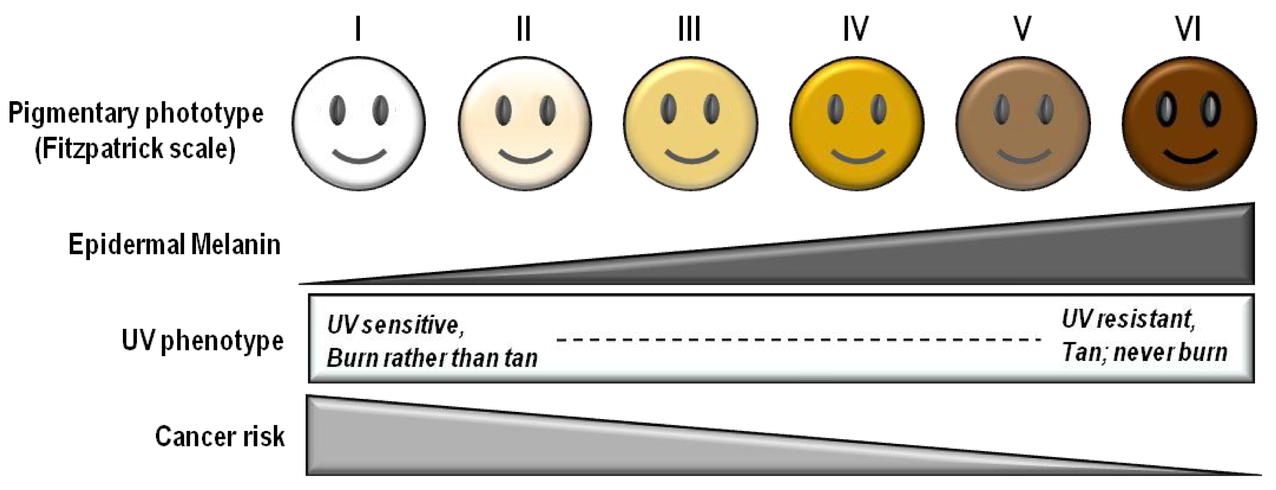 The Fitzpatrick scale and the risk of skin cancer, CC BY 3.0, John D’Orazio et al. "UV Radiation and the Skin" Int. J. Mol. Sci. 2013, 14(6), 12222-12248; doi:10.3390/ijms140612222 ·
My "Six Questions" series is taking a few weeks' break after 14 issues while I prepare the next series. Which gives me the opportunity of asking: who would you like to be featured in the next series of interviews? I'm just a few interviews away from completing this, so please do shout.

Also, in case you're in the mood for some GCP and don't have an account... "Whenever someone signs up for a Google Cloud free trial using your referral link, they'll get US $350 worth of credits — that's US $50 more than the standard free trial offer. When any of your referrals become a paying customer, you will earn US $100 free credits which will be deposited automatically into your account. There's no cap on how many people you refer or how many rewards you receive. GCP Referral Code."
·
'till next week,
Giuseppe @puntofisso
Become a Friend of Quantum of Sollazzo →
If you enjoy this newsletter, you can support it by becoming a GitHub Sponsor. Or you can Buy Me a Coffee. I'll send you an Open Data Rottweiler sticker.
Quantum of Sollazzo will always be free.
You're receiving this email because you subscribed to Quantum of Sollazzo, a weekly newsletter covering all things data, written by Giuseppe Sollazzo (@puntofisso). If you have a product or service to promote and want to support this newsletter, you can sponsor an issue.
Topical
When will Europe phase out coal?
Lisa Charlotte Muth of Datawrapper, a well known figure to our readers, looks at how countries in Europe and beyond are trying to move from coal to renewable sources of energy.

How common is long COVID? That depends on how you measure it
The Office for National Statistics' Daniel Ayoubkhani explains their work on assessing that "643,000 people in private households in the UK could be experiencing activity-limiting long COVID symptoms."
How The New York Times changed after September 11
"An analysis of 1,574,957 articles investigates changes in the NYT's evolution between September 2001 and December 2020", with all source code available. By Francesco Piccinelli.

COVID cases hold steady while hospitalizations, deaths rise
According to Axios, things aren't going too well in the US: "While the overall COVID case rate increased less than 1% over the last two weeks, hospitalizations increased 4% in the same time frame, and the seven-day rolling average of deaths rose 29%."

Israel’s Rising Covid Cases Aren’t So Scary This Time
"While the news may look grim, and the government has been scrambling to respond, the reality is more prosaic: Israel hasn’t defeated the virus, but it has probably redefined what success against the virus looks like. It’s a messy reality, but not an intolerable one."

Data suggests you should get the COVID-19 vaccine
At least in New Zealand, according to this well illustrated data analysis.

Tools & Tutorials
skimpy
"skimpy is a light weight tool that provides summary statistics about variables in data frames within the console. Think of it as a super version of df.describe()."
A useful tool for Exploratory Data Analysis (EDA) created by the ONS' Arthur Turrell.

GlueSQL
"GlueSQL is a SQL database library written in Rust. It provides a parser (sqlparser-rs), execution layer, and optional storage (sled) packaged into a single library. Developers can choose to use GlueSQL to build their own SQL database, or as an embedded SQL database using the default storage engine."
Open-Meteo
"Open-Meteo offers free weather forecast APIs for open-source developers and non-commercial use. No API key is required."
Yes, non-commercial use only, which should be ok for most users. But I'm a little puzzle as to why they have chosen this licence and where the data comes from (they say National Weather Forecasters).

FullFact Content API
Fact checking organisation FullFact is now granting access to their API (but there's an authorisation process to go through). "You can use this API to retrieve fact checks and fact check metadata."
zinggAI
ZinggAI offers "scalable fuzzy matching for data mastering, deduplication and entity resolution". It includes connectors to most of the big platforms.
Mockachino
Mockachino is a website allowing users to create and run "a mock JSON API in 10 seconds."

How percentile approximation works (and why it's more useful than averages)
Although this article is in the context of TimescaleDB, some of the chunky bits relate to understanding percentiles and how to use them in PostgreSQL, so they might be useful.
Data thinking
Possession Is The Puzzle Of Soccer Analytics. These Models Are Trying To Solve It.
"In 2011, a software developer named Sarah Rudd got fed up with conventional soccer stats. It was easy to count how many passes a player attempted and completed, but not all passes are equal. “We know passing percentage is a terrible metric for evaluating how good of a passer you are,” she told me. What were those actions really worth?"
Great piece by FiveThirtyEight: not all data/analytics matter.

Why data scientists shouldn’t need to know Kubernetes
"This post is to argue that while it’s good for data scientists to own the entire stack, they can do so without having to know K8s if they leverage a good infrastructure abstraction tool that allows them to focus on actual data science instead of getting YAML files to work."
Yes. And no. :-)
Maybe I link this up too much to my own experience, but in my case the key to having fun at work and being productive implied both some degree of specific knowledge as well as a good generalist approach. And I don't mean just now, when I'm doing very little technical work – this was even more true when I had a data centre with 300 servers running the most disparate services and platforms, and a total team of 3 to run it.
Dataviz & Interactive
Who would win if a general election was held tomorrow?
"Make your prediction and see the latest forecast with Britain Predicts, the New Statesman's election calculator", i.e. the latest, interactive, polling forecast by Patrick E. Scott and team at the New Statesman.

What did Earth look like ... million years ago?
Basically, find your home in the Pangea.

Traffic filters etc
"Traffic filters and low-traffic neighbourhoods have been the target of some toxic discourse recently. So we decided to set the record straight. We did some door-knocking around the country and we’ve got some heartening stats for everyone."
An interesting Twitter thread from environmental charity Possible, with illustrations by Duncan Geere.

Heritage Connector visualisation
By researcher Kalyan Dutia at the Science Museum, "this is a visualisation of a knowledge graph created from the Science Museum Group's online collection, blog and academic journal using machine learning. It's part of the Heritage Connector project."
The project is described here.

AI
AI Skunkworks projects
Sorry to blow my own trumpet again ;-) But we've now published a web page with summaries of all our ongoing projects, which we'll keep up to date as we complete them and onboard new ones. Suggestions and feedback are much appreciated.
quantum of sollazzo is supported by ProofRed's excellent proofreading service. If you need high-quality copy editing or proofreading, head to http://proofred.co.uk. Oh, they also make really good explainer videos.
