An APS skills crisis
Hey ,
The APS Annual “State of the Service” report was released yesterday, and like many in Canberra, I’ve had a read through to glean some insights into how the APS is going.
Make sure you read to the end for additional data insights you won’t see anywhere else.
It is pretty clear we’re in the midst of an APS skills crisis with 88% of agencies reporting critical skills shortages.
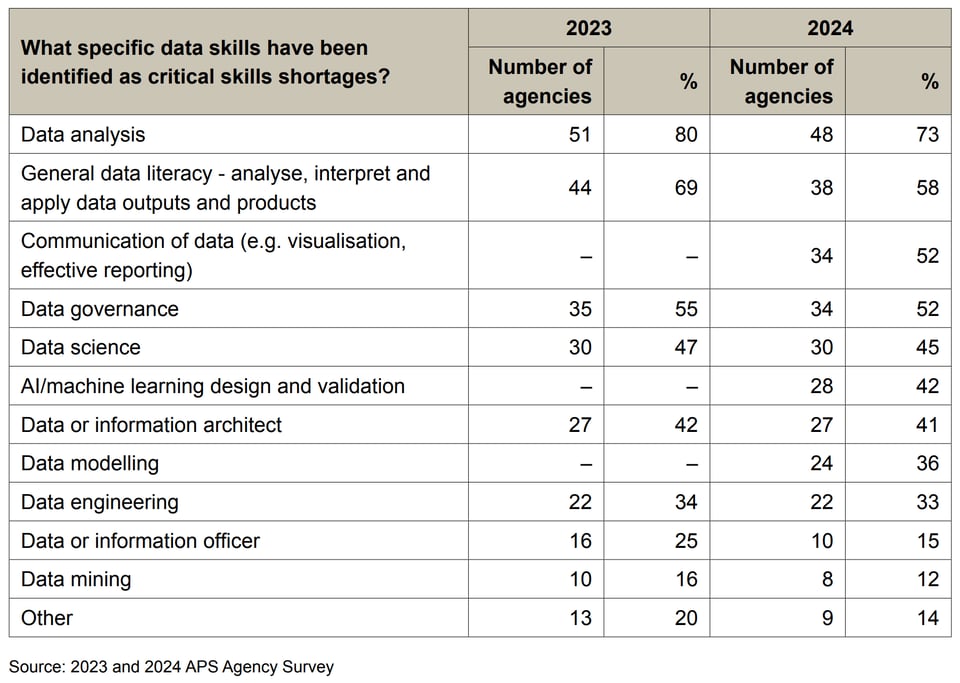
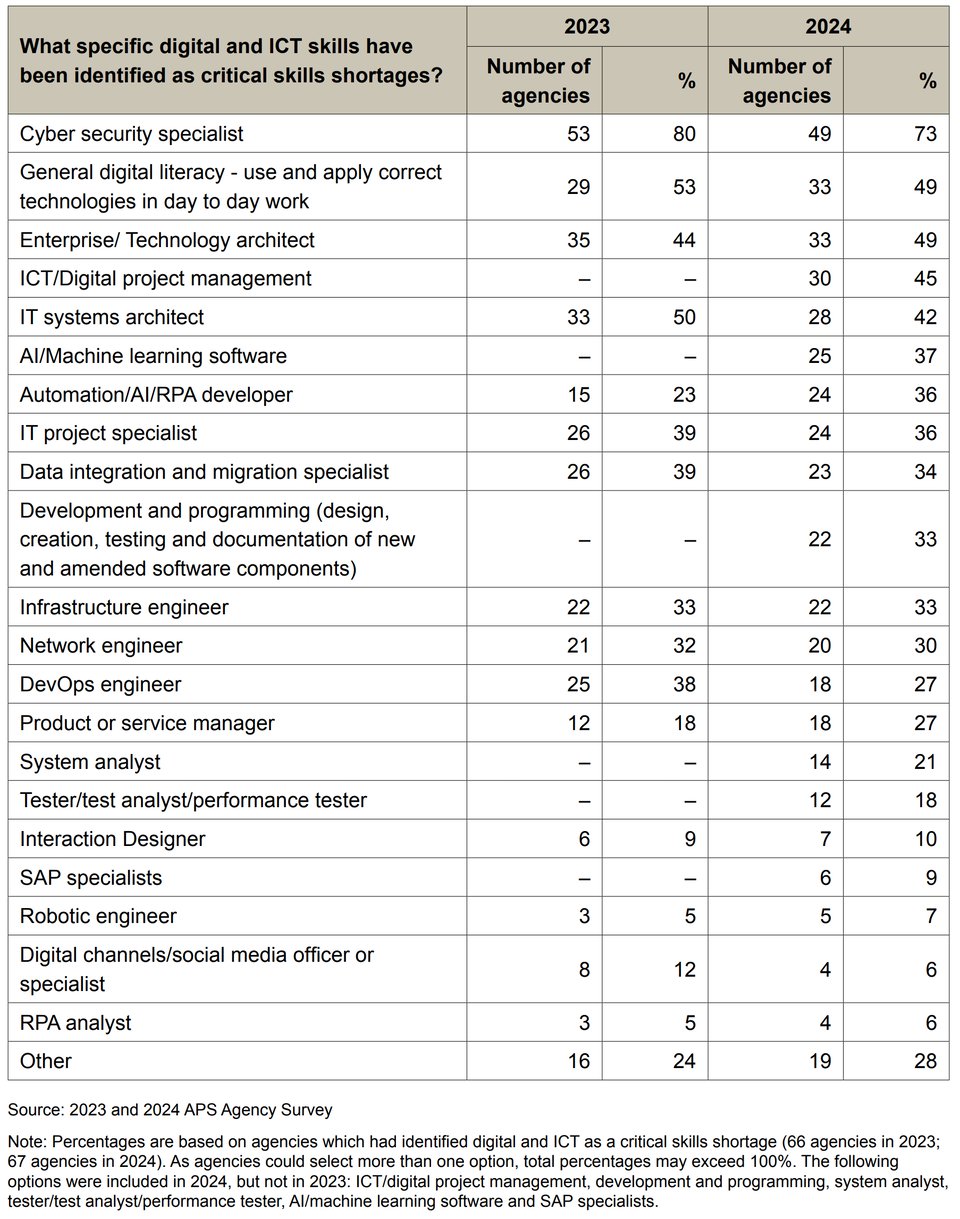
Which skills? Well 8 in 10 agencies reported critical shortages of “Digital and ICT” and “Data” skills, more than twice the proportion of the next highest critical skill shortage, “project management”.

The report goes on to break down the specific skills within those categories.
Data analysis tops the list of critical data skills missing with approximately three quarters of APS agencies experiencing a critical skills shortage in that area.

Cyber security tops the list of digital and ICT skills that are critically missing from APS agencies.

It’s pretty stark to see those numbers.
Is there a strategy to address this?
The Government’s Data and Digital Strategy has one of it’s measures of success the proportion of the public service in Data and Digital roles (see my ”Honest Review” of the strategy here).
So how is the APS tracking on that measure?
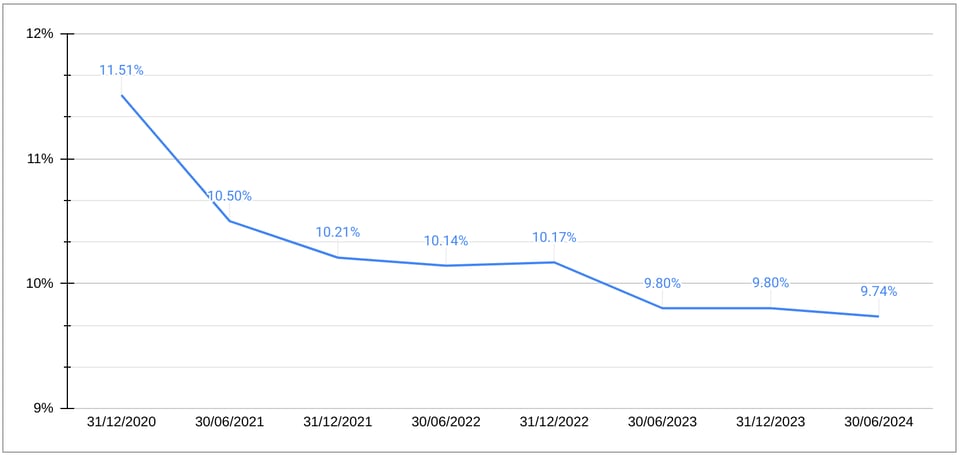
Trends over time are not reported by the APSC, nor do they even report the “Data and digital” number in their State of the Service report. You can get the most recent number - 9.7% - if you add upp the three job categories that comprise Data and Digital on page 295 of the report.
But to really see how the APS is going, we need to look at the numbers over time.
So I’ve compiled the numbers myself.
Unfortunately the results aren’t promising.
While the total number of APS employees in Data and Digital has grown slightly - from 14,486 in Dec 2020 to 15,439 in June 2024 - because the APS overall has grown in size much more, the proportion of APS employees in Data and Digital continues to fall.

How much of a crisis is this?
It’s difficult - and - to be fair - Data and digital skills are in short supply across all industries, why would the APS be any different?
In my humble opinion, what would be a better measure of how the APS is tracking in delivering services would be productivity rather than just a single “factor of production” such as headcount.
But, measuring actual public service productivity would be much more difficult.
One factor affecting productivity is the skills mix of the APS. But what data do we have that looks at that?
Understanding skill demand across the APS
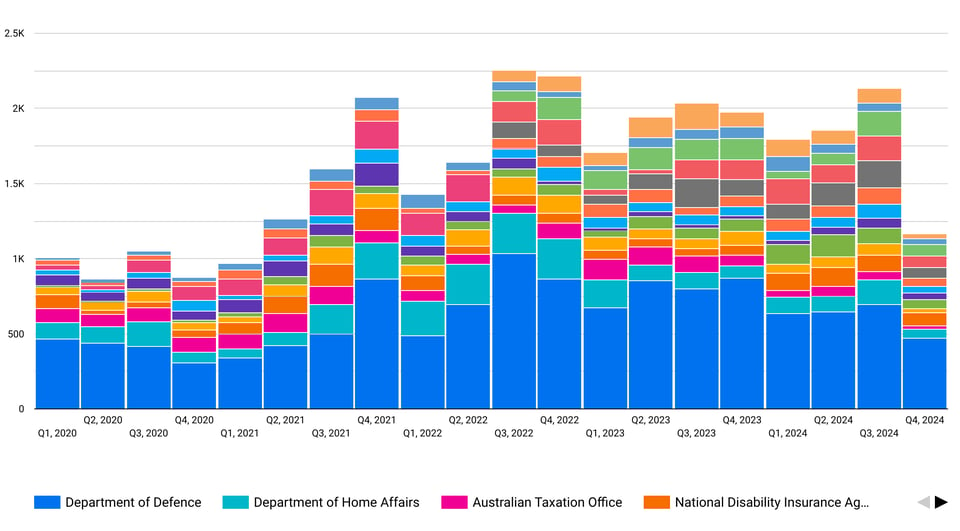
To that end, I’ve been exploring the APS jobs data which - among other things - contains job descriptions for all advertised jobs across the APS.
Understanding which specific skills and duties are in demand provides some clues to APS productivity, I think.
Of course, this is only part of the picture - but the APS Jobs data is the best publically available detailed data on APS skills that I’m aware of.
Not even the APS’ own Employment Database (APSED) contains skills details (just job families and demographics).
To give you a sense of the APS Jobs data - here’s a chart which shows a count of jobs advertised by agency each quarter (note Q4 2024 isn’t complete yet…)

It’s a rich data source - I’m not quite ready to dive into the details yet - but make sure you subscribe to this newsletter if you’d like to see my analysis when it’s published.
As always reply with any feedback, questions or suggestions for future topics, and thanks for reading!
Data Note - the latest release of figures from the June 2024 includes almost 27,000 employees without job family categories. I have excluded them from my chart above, because some of them are likely to be in Data and Digital too, so the proportions above are based on a APS size of 185k - 27k employees not categorised yet…
Update - 23 Jan 2025
Additional details provided by Strategy and Implementation team at the DTA
After publishing this newsletter, I reached out to the Data and Digital team to enquire why my numbers were different to theirs.
I asked:
I was hoping you could help me understand some of the statistics from your (updated) implementation plan.
Specifically, Under Data and digital foundations, % of current APS workforce in data and digital jobs - your implementation plan states the figure was 10.8% in December 2022 and 10.4% in June 2024, but this does not appear to align with the statistics published by the APSC.
Their statistics show 10.17% in December 2022 and 9.74% in June 2024.
The most recent figure can be double checked by looking at page 295 of the recently released APSC state of the service survey - if you add up "ICT and Digital Solutions" 5.0%, "Data and Research" 3.7% and "Information and Knowledge Management" 1.1% you get 9.8% - much closer to what their detailed statistical release has - 9.74% - than the figure published in your implementation plan - 10.4%.
Their helpful reply
The difference between our Implementation Plan and the APSC State of the Service Roadshow Report is how the Australian Public service Employment Database (APSED) is used and calculated to inform these statistics.
In the State of the Service Report, the APSC use the dataset to report only at the job family level (i.e. ICT and Digital Solutions, Data and Research, etc). Outside of these job families there are others that have roles that relate to data and digital. For example, in the Communication and Marketing family one of these roles is ‘Digital Channels/Social Media Officer or Specialist’.
To ensure that we are reflecting the broader data and digital workforce in our Metrics Framework we look at a variety of job families (listed below with an example of the roles) and include job roles that would require data and/or digital skills to calculate the 10.4% figure that you see in the most recent update.
Administration (i.e. Data Entry Officer)
Communications and Marketing (i.e. Web/Publication Officer)
ICT and Digital Solutions (i.e. Software Engineer)
Intelligence (i.e. Cyber Security Analyst)
Portfolio, Program and Project Management (i.e. SCRUM Master)
Data and Research (i.e. Data Scientist)
Science and Health (i.e. Weather and Climate Researcher)
So, it turns out my analysis is not directly comparable as I'm using the APSC published job families, which are not as detailed as the APSED categories used for the D&D Strategy figures.