#### PerformanceNewsletter
|
#### Issue 49
|
|
#### Editor’s Note
Finding performance bottlenecks can vary like night and day. Some are incredibly easy to uncover and address. Some can take weeks in debugging and analysis to arrive at even the simplest solution.
Looking for performance wins, small or big, means observing and analysing a lot of data. To be able to draw meaningful conclusions, we have to remember that **just because there’s a correlation between two points, it doesn’t mean there’s causation. **
Questioning logical fallacies might be another step to be added to our already complex workflows, but a necessary one to understand what’s truly hiding beneath the numbers.
— Karolina
|
|
|
|
#### article
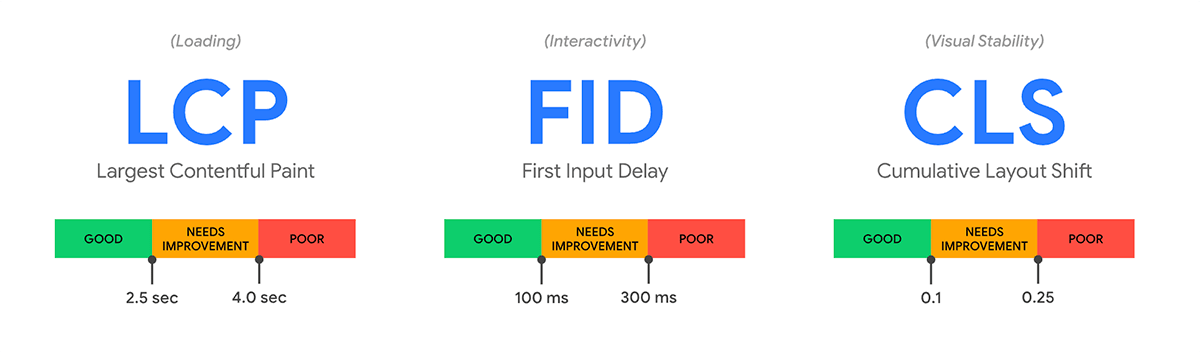
## Start monitoring Core Web Vitals
Recently, Google announced a new initiative dubbed Web Vitals, focusing on highlighting the most impactful performance metrics. Currently consisting of loading, interactivity, and visual stability metrics (LCP, FID and CLS), web vitals should be a part of your performance testing.
[]()[Introducing Web Vitals: essential metrics for a healthy site →](https://blog.chromium.org/2020/05/introducing-web-vitals-essential-metrics.html)
#### talk

## Monitor and debug Cumulative Layout Shift
Since Cumulative Layout Shift is gaining in importance both through inclusion in Lighthouse 6 scoring and being a Web Vital metric, it’s worth learning more about it. Watch [Annie Sullivan](https://twitter.com/anniesullie) and [Steve Kobes](https://www.linkedin.com/in/steve-kobes/) explain how it was developed, how it’s measured and how it can be improved.
[]()[Understanding Cumulative Layout Shift →](https://www.youtube.com/watch?v=zIJuY-JCjqw)
#### article
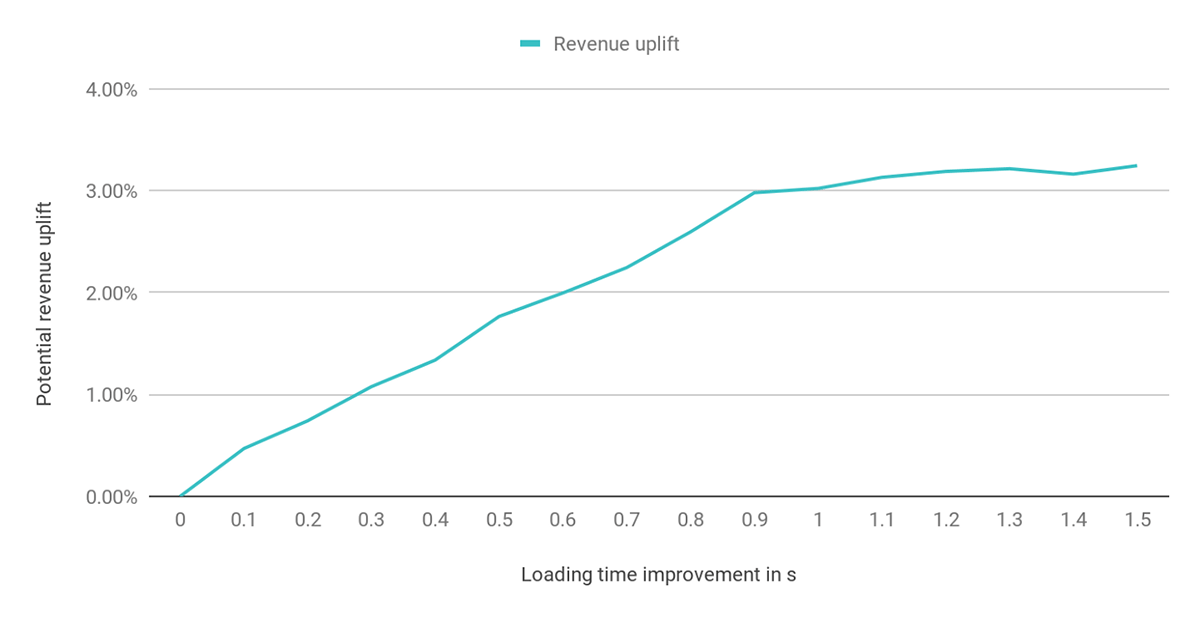
## Learn how to correlate speed to conversions
Often, the hard work of convincing stakeholders to prioritise performance begins at correlating the financial gains that come with fast sites and apps. It’s not an easy task. In his article, [Ole Bossdorf](https://www.linkedin.com/in/olebossdorf/?originalSubdomain=de) uncovers how to analyse your data and draw meaningful conclusions.
[]()[The Business Value of Site Speed →](https://insights.project-a.com/the-business-value-of-site-speed-and-how-to-analyze-it-step-by-step-b01658e126cb)
#### article

## See the impact behind cookie consent popups
Turns out, that consent popups can not only cause frustration amongst users but also degrade performance. In his article, [Simon Hearne](https://twitter.com/SimonHearne) walks through an example of debugging the speed impact of cookie acceptance versus denial.
[]()[Measuring Performance behind consent popups →](https://simonhearne.com/2020/testing-behind-consent/)
#### article
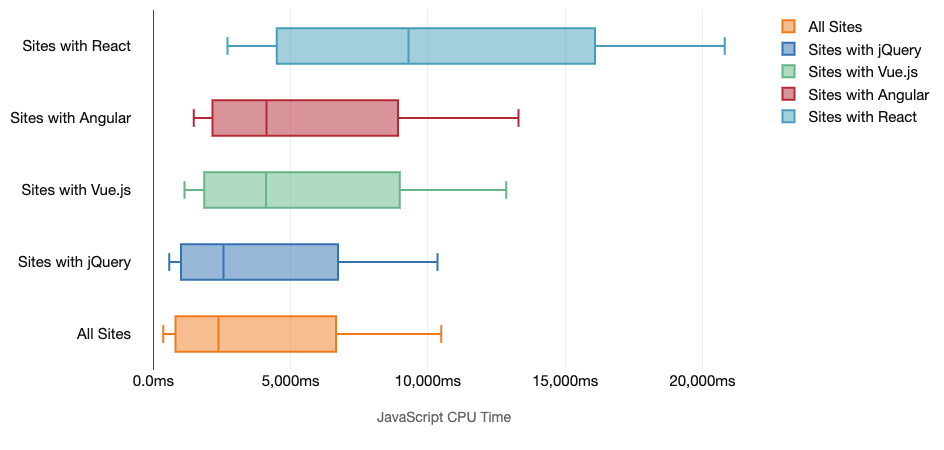
## Recognise the real impact of JS frameworks
There’s no faster way to degrade your sites’ performance than to use a bunch of JavaScript. In his article, [Tim Kadlec](https://twitter.com/tkadlec) showcases comprehensive data backing this statement and offers practical alternatives to reducing your script footprints.
[]()[The Cost of Javascript Frameworks →](https://timkadlec.com/remembers/2020-04-21-the-cost-of-javascript-frameworks/)
#### article
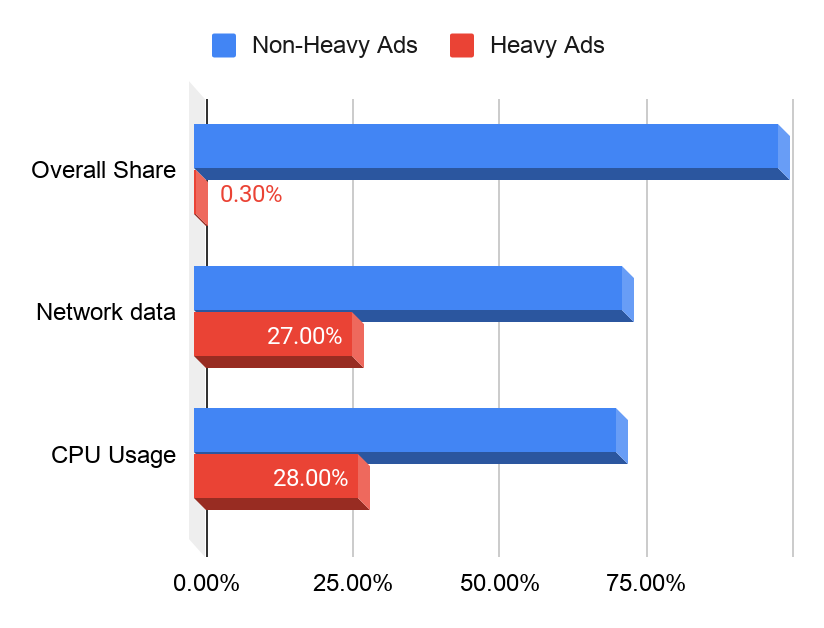
## Find out if your ads are going to be blocked
Chrome is experimenting with a new mechanism, Heavy Ad Intervention, that in the future will prevent ads with significant main thread usage and large size from displaying. If you’re working on a platform with ads, the explanation by [Rowan Merewood](https://twitter.com/rowan_m) is worth reading.
[]()[Handling Heavy Ad Interventions →](https://developers.google.com/web/updates/2020/05/heavy-ad-interventions)
|
|
####
Spread the word about perf.email
We’d love to see more people reading
[perf.email](https://perf.email/); if you’d
like to help—forward this email to a friend, tweet, or
shout from a rooftop. It goes a long way. ✌🏻
|
|