͏ ͏ ͏ ͏ ͏ ͏ ͏ ͏ ͏ ͏ ͏ ͏ ͏ ͏ ͏ ͏ ͏ ͏ ͏ ͏ ͏ ͏ ͏ ͏ ͏ ͏ ͏ ͏ ͏ ͏ ͏ ͏ ͏ ͏ ͏ ͏ ͏ ͏ ͏ ͏ ͏ ͏ ͏ ͏ ͏ ͏ ͏ ͏ ͏ ͏ ͏ ͏ ͏ ͏ ͏ ͏ ͏ ͏ ͏ ͏ ͏ ͏ ͏ ͏ ͏ ͏ ͏ ͏ ͏ ͏ ͏ ͏ ͏ ͏ ͏ ͏ ͏ ͏ ͏ ͏ ͏ ͏ ͏ ͏ ͏ ͏ ͏ ͏ ͏ ͏ ͏ ͏ ͏ ͏ ͏ ͏ ͏ ͏ ͏ ͏ ͏ ͏ ͏ ͏ ͏ ͏ ͏ ͏ ͏ ͏ ͏ ͏ ͏ ͏ ͏ ͏ ͏ ͏ ͏ ͏
|
#### Editor’s note
|
| |
|
Optimising the delivery of assets is one of the first steps in ensuring good web performance. It’s essential to employ aggressive compression, effective caching policies and monitor Time to First Byte and asset size.
However, those assets must be parsed by the browser, and that’s where JavaScript can cause significant user experience headaches. We should focus on efficiently delivering assets and executing scripts to achieve good web performance.
This is where the term ”front-end web performance” gets murky, as web performance encompasses infrastructure, database choices and deep knowledge of how browsers work on top of what we categorise as front-end. Instead of classifying in realms of front and back-end performance, we should treat speed holistically.
Ask yourself: **in an asset’s lifetime, when could it be faster?**
|
| |
|
|
Karolina
|
| |
| |
|
|
|
|
#### What’s Performance newsletter?
|
| |
|
Performance Newsletter is a fortnightly mailing by [Calibre](https://calibreapp.com), featuring web performance tools, talks and resources.
Don’t worry—we don’t spam. If you’d like to leave, [unsubscribe]() at any time. Suggest content [here](mailto:[email protected]).
|
|
|
| |
|
| |
|
|
|
| |
|
# Articles
|
|

|
|
| |
 |
| |
|
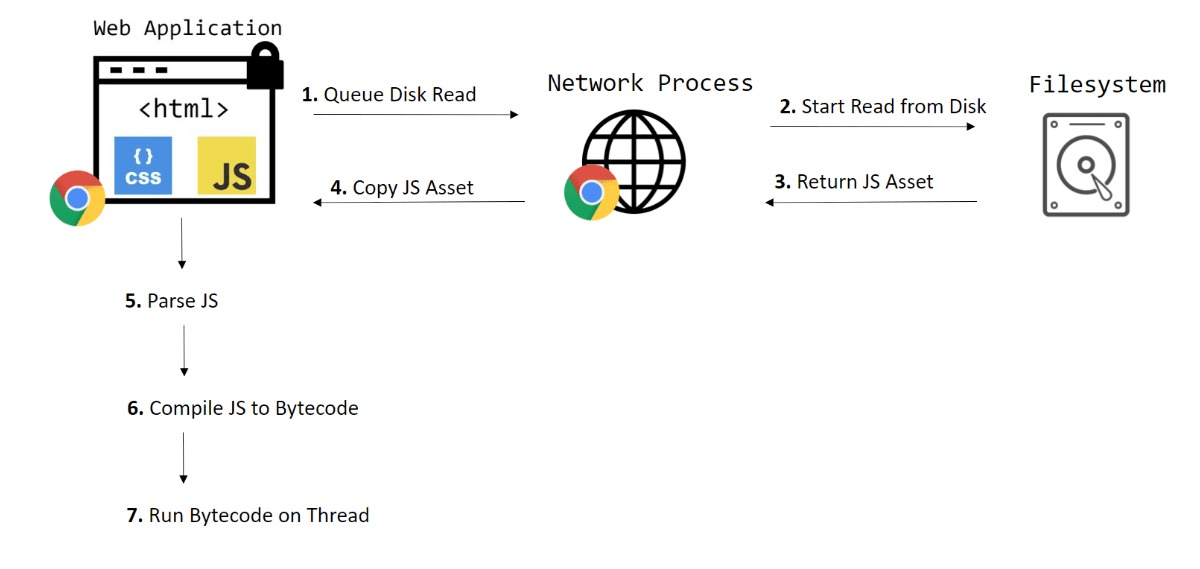
### [Why Your Cached JavaScript Is Still Slow and Incurs Performance Overhead](https://www.webperf.tips/tip/cached-js-misconceptions/)
|
| |
|
[Joe Liccini](https://github.com/josephliccini)
|
|
While caching is essential in optimising network overhead, we must also focus on reducing computational overhead. Find out the most common misconceptions about caching and how to find webperf issues in JavaScript!
|
|
|
| |
|
 |
| |
|
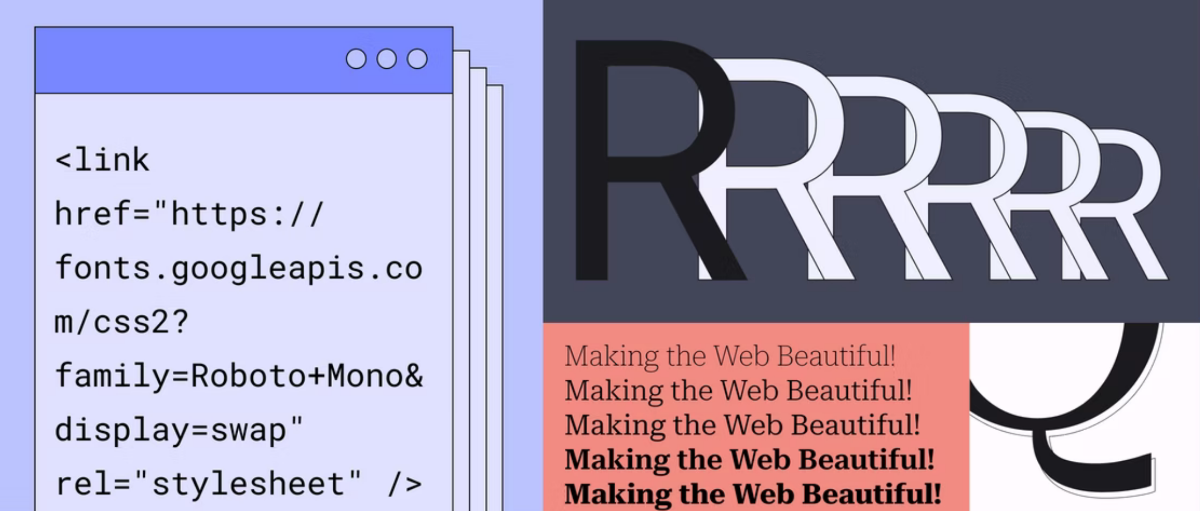
### [An API for fast, beautiful web fonts](https://web.dev/api-for-fast-beautiful-web-fonts/)
|
| |
|
[Jimmy Mooney](https://twitter.com/jimmy0x52)
|
|
Using Google Fonts? Learn about the Google Fonts CSS API that can help optimise the delivery and size of font files!
|
|
|
| |
|
|
### [SPAs: theory versus practice](https://nolanlawson.com/2022/06/27/spas-theory-versus-practice/)
|
| |
|
[Nolan Lawson](https://toot.cafe/@nolan)
|
|
Whether SPAs are the modern application saviour or destroyer is an ongoing debate. Here are a few considered arguments for the single versus multi-page apps discussion.
|
|
|
| |
|
|
### [Frontend Web Performance Essentials: How To Not Block The Browser](https://medium.com/@matthew.costello/frontend-web-performance-the-essentials-1-cb6513e1c3a1)
|
| |
|
[Matthew Costello](https://www.linkedin.com/in/matthew-costello-dev/?originalSubdomain=de)
|
|
Can we optimise speed without understanding how browsers work? Kind of. Understand the Event Loop, Web Workers, yielding to the browser, and how you can use asynchronous scheduling—a few vital concepts to front-end performance.
|
|
|
| |
|
|
|
|
|
| |
|
# Tools
|
|

|
|
| |
 |
| |
|
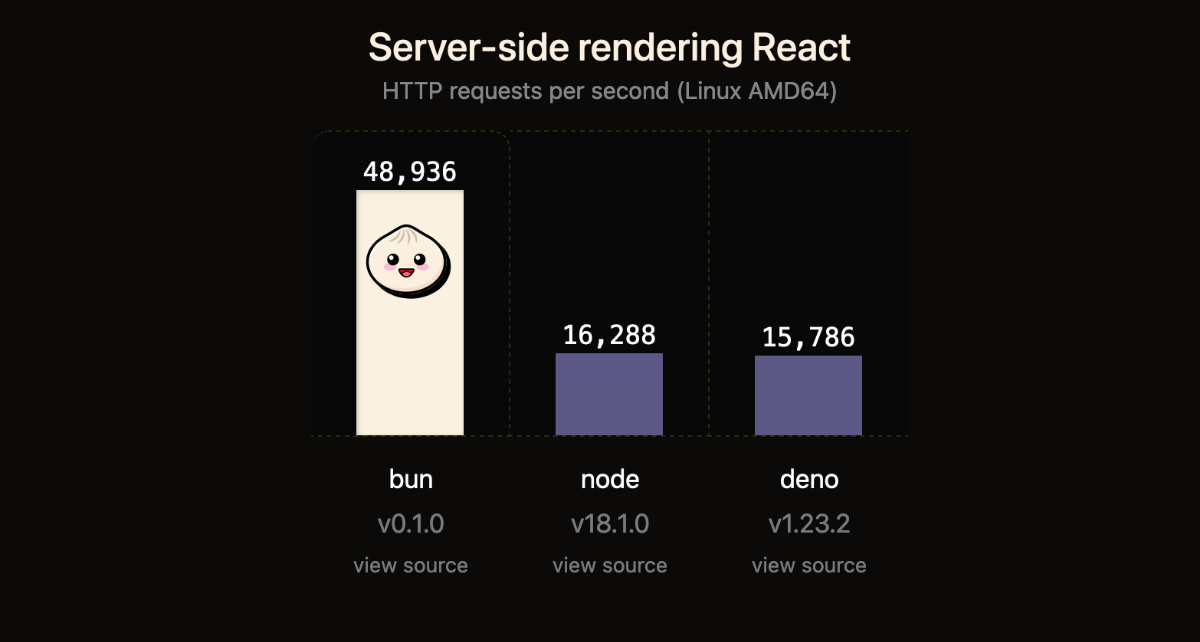
### [Bun: a fast all-in-one JavaScript runtime](https://bun.sh/)
|
| |
|
[Jarred Sumner](https://twitter.com/jarredsumner) & [contributors](https://github.com/oven-sh/bun/graphs/contributors)
|
|
We featured Bun some time ago, but now it’s ready to be used by the wider public! Bun is a new JavaScript runtime with a built-in native bundler, transpiler, task runner and npm client. It’s also built with performance in mind.
|
|
|
| |
|
|
|
|
|
| |
|
# Courses, Talks & Podcasts
|
|

|
|
| |
 |
| |
|
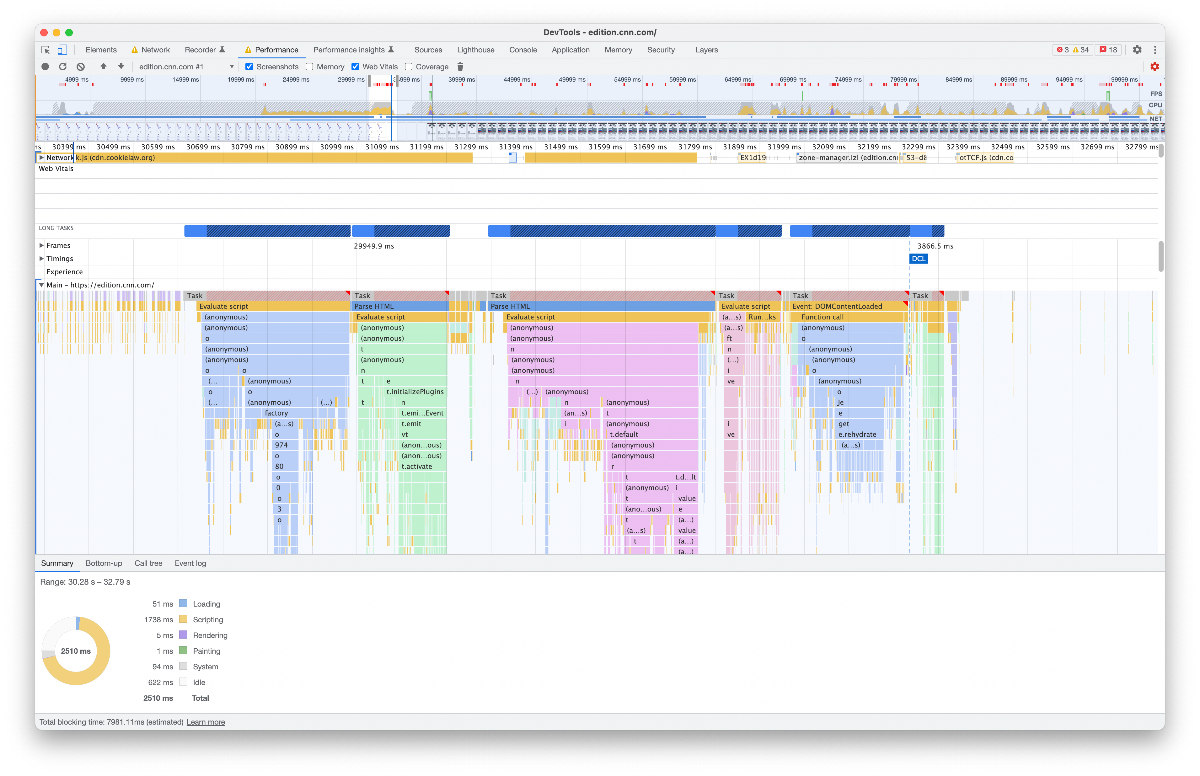
### [Setting up DevTools for Performance Testing](https://csswizardry.gumroad.com/l/perfect-devtools/PERFEMAIL15)
|
| |
|
[Harry Roberts](https://twitter.com/csswizardry/)
|
|
Developer tooling within browsers is more powerful than ever, but with that power comes the usage complexity. This video course will teach you how to set up your DevTools for performance auditing. Use the **PERFEMAIL15** code for 15% discount!
|
|
|
| |
|
|
|