🌐 🗣️ Open Source Weekly - Issue #3
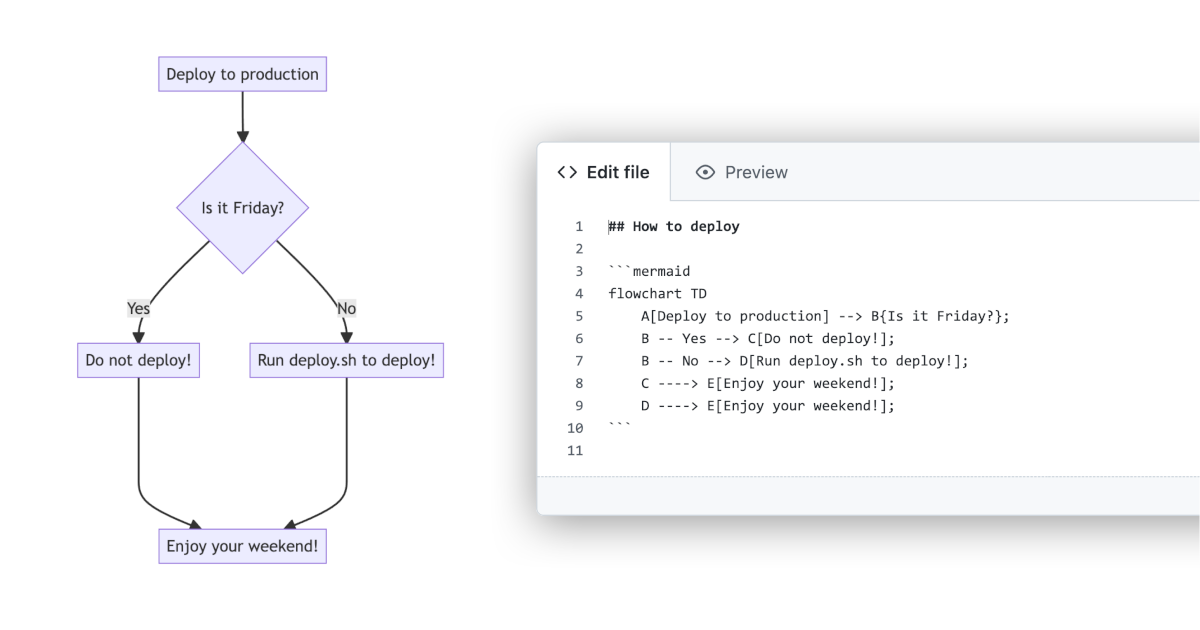
GitHub include diagrams in your Markdown files with Mermaid
Mermaidis a JavaScript based diagramming and charting tool that takes Markdown-inspired text definitions and creates diagrams dynamically in the browser.
Include diagrams in your Markdown files with Mermaid | The GitHub Blog
Mermaid is a JavaScript based diagramming and charting tool that takes Markdown-inspired text definitions and creates diagrams dynamically in the browser.

Bad UI Battle | Awesome Bad UI
Awesome list of open-source startup alternatives to well-known SaaS products 🚀
Awesome list of open-source startup alternatives to well-known SaaS products 🚀 - GitHub - RunaCapital/awesome-oss-alternatives: Awesome list of open-source startup alternatives to well-known SaaS products 🚀
GitHub - RunaCapital/awesome-oss-alternatives: Awesome list of open-source startup alternatives to well-known SaaS products 🚀
Awesome list of open-source startup alternatives to well-known SaaS products 🚀 - GitHub - RunaCapital/awesome-oss-alternatives: Awesome list of open-source startup alternatives to well-known SaaS p…
![]()
General-purpose bitemporal database for SQL, Datalog & graph queries
XTDBfollows an unbundled architectural approach, which means that it is assembled from decoupled components through the use of an immutable log and document store at the core of its design. A range of storage options are available for embedded usage and cloud native scaling. Bitemporal indexing of schemaless documents enables broad possibilities for creating layered extensions on top, such as to add additional transaction, query, and schema capabilities. In addition to SQL,XTDBsupplies a Datalog query interface that can be used to express complex joins and recursive graph traversals.
Your Spotify, self-hosted tracking dashboard
https://www.reddit.com/r/opensource/comments/svu2zz/your_spotify_self_hosted_tracking_dashboard/It’s composed of a server, polling the Spotify API, a MongoDB database to store that data, and a web client to allow the user to navigate through his statistics.