🌱 Time flies and March is here! Would your like to check out some awesome datasets and maps? Even better, to plot a map like the one below by yourself? This is the issue for you.
Highlights
📊 A new dataset released
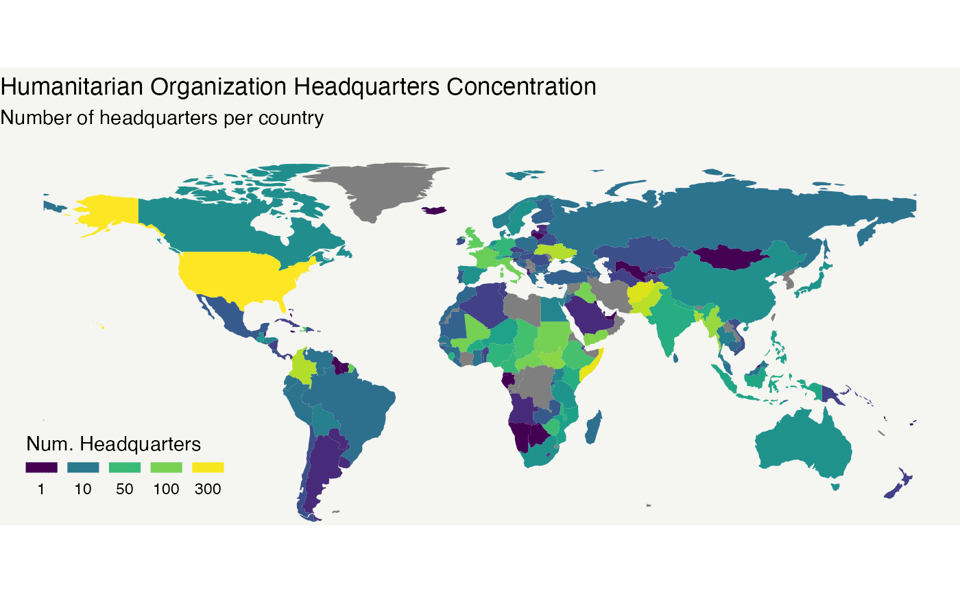
We have a new dataset released that cover data about humanitarian organizations ⛑️!
openwashdata Blog: Creating and visualizing maps of WASH data (I)
How often do you refer to a map in WASH monitoring and evaluation? How many datasets you have worked with containing geospaitial information? Within openwashdata, many of the released datasets are featured with a map visualization. Valuable data points such as water pumps, waste skips, or humanitarian organization headquarters are shown. Seizing the importance of geospatial data, we are providing a series of blog posts to learn about how to create maps in R specific with WASH data. By the end of the series, you will be able to plot an informative and beautiful map like the header.
Get Involved
We truly believe that openwashdata project prospers when we have YOU work together and promote open science and data practice! No matter what background you are from, we come up with some ways for you to get involved:
- Spread the word. Forward this email.
- Got more ideas? Leave us a message on Matrix to collaborate!
You just read issue #8 of openwashdata news. You can also browse the full archives of this newsletter.