
Timeline of gambling addicts
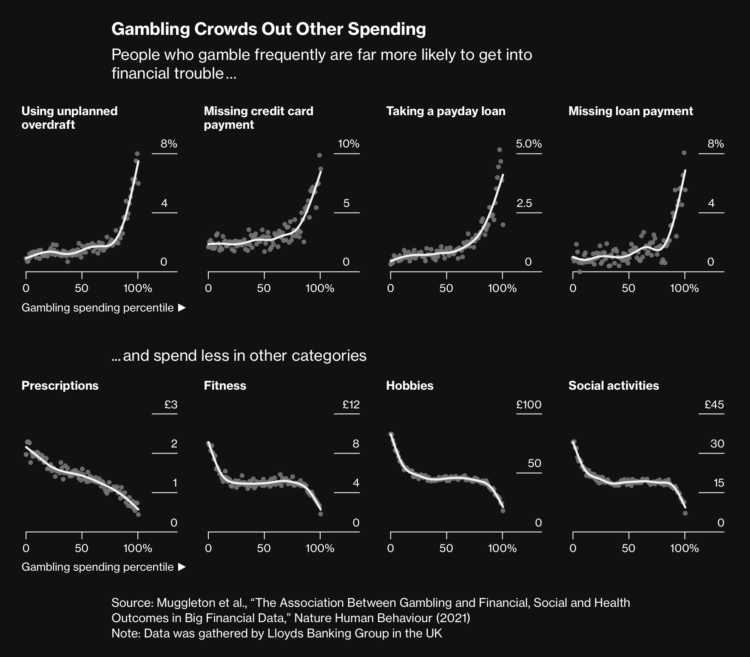
Using anonymized credit card data, Bloomberg illustrated a three-year timeline of online gambling. As a backdrop, Bloomberg identified people who made their first transaction with an online sportsbook in Massachusetts, when it was legalized in the state.
Because legalized online sports gambling is a relatively new phenomenon in the US, few studies have been able to measure its impact beyond high-level, aggregate statistics. But in other countries, academics have been able to run robust, yearslong analyses. The 2021 study out of the UK used individual-level transaction data from 6.5 million customers of Lloyds Banking Group, or 10.6% of the country’s population, over a course of seven years. The study paints a dark picture: The more money people spend gambling online, the worse their financial situation.
The consequences extend into their personal lives too. They spend less time on hobbies, education and social activities. They travel and exercise less. They’re more likely to spend their nights awake.
It’s hard to separate causation and correlation in a lot of the examples. People who are likely to miss a loan payment are probably likely to gamble a lot, because money management is not a forte overall. So while we don’t know that online gambling brings a bunch of problems, it is likely that having a casino in your pocket does not help the situation.
Tags: Bloomberg, gambling, prediction market, sports, timeline
Annotating line charts for presentation
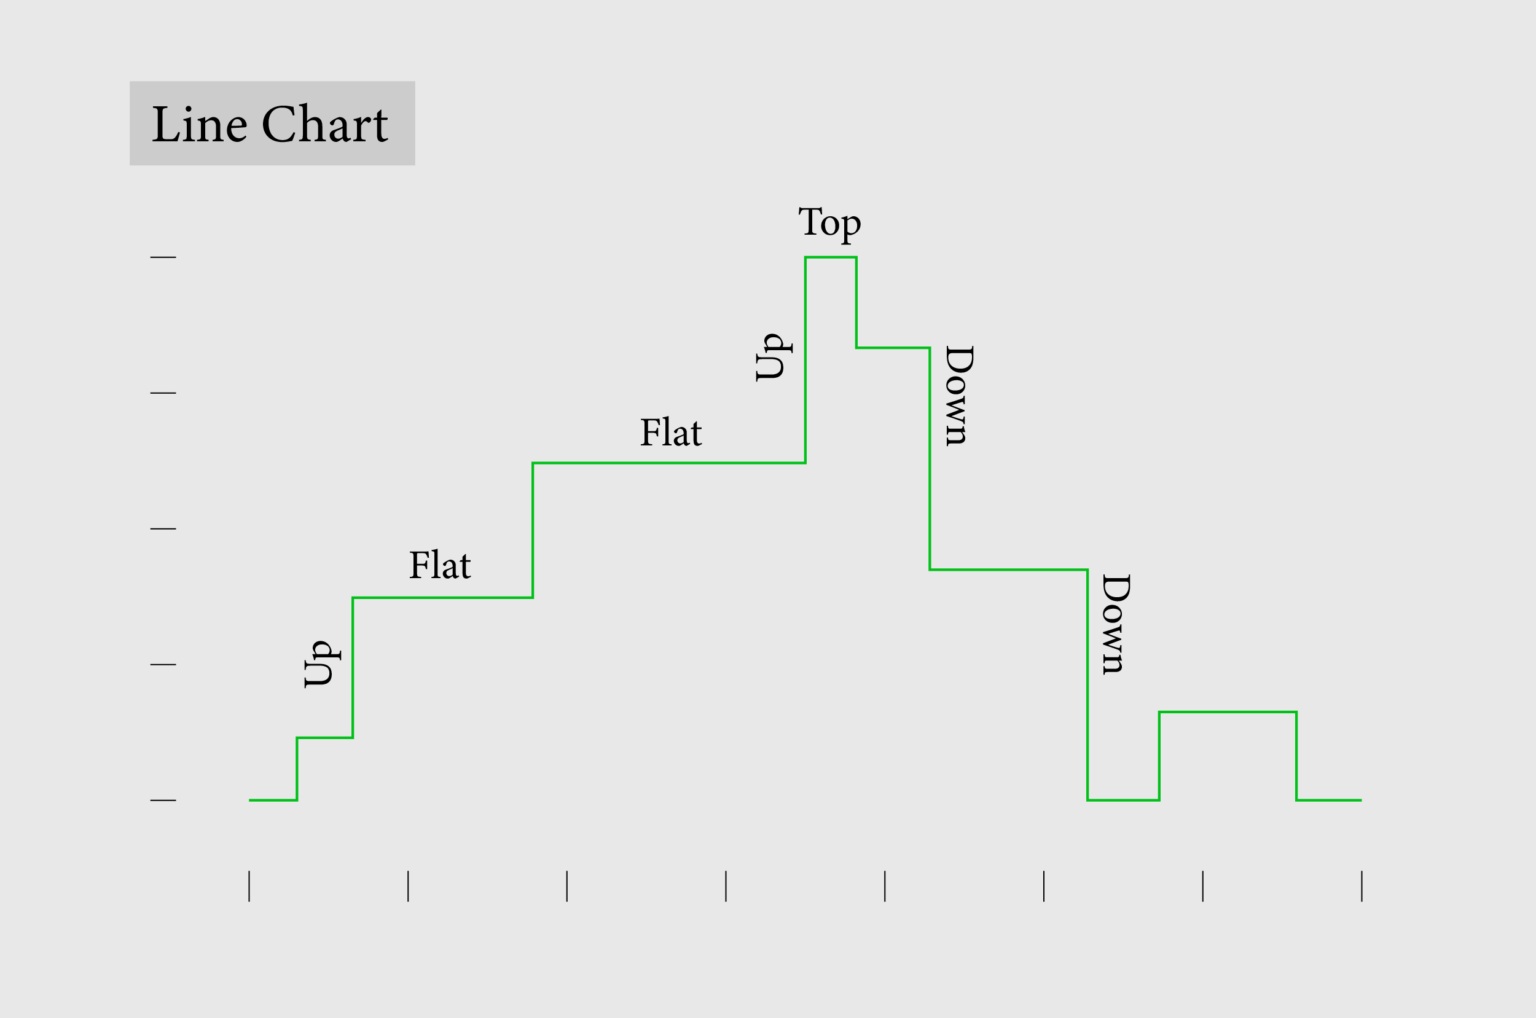
FlowingData members received No. 414 of The Process yesterday. This week, we get into specifics for annotation on line charts to draw attention and communicate patterns more clearly.
Become a member to access this issue and the collection of 413 other guides and tips on making charts that don't look like slop. It's the best way to support FlowingData.
Thanks,
Nathan
FlowingData is 100% made possible by members. Join today and get access to courses, guides, and more resources from this real person (me, Nathan).