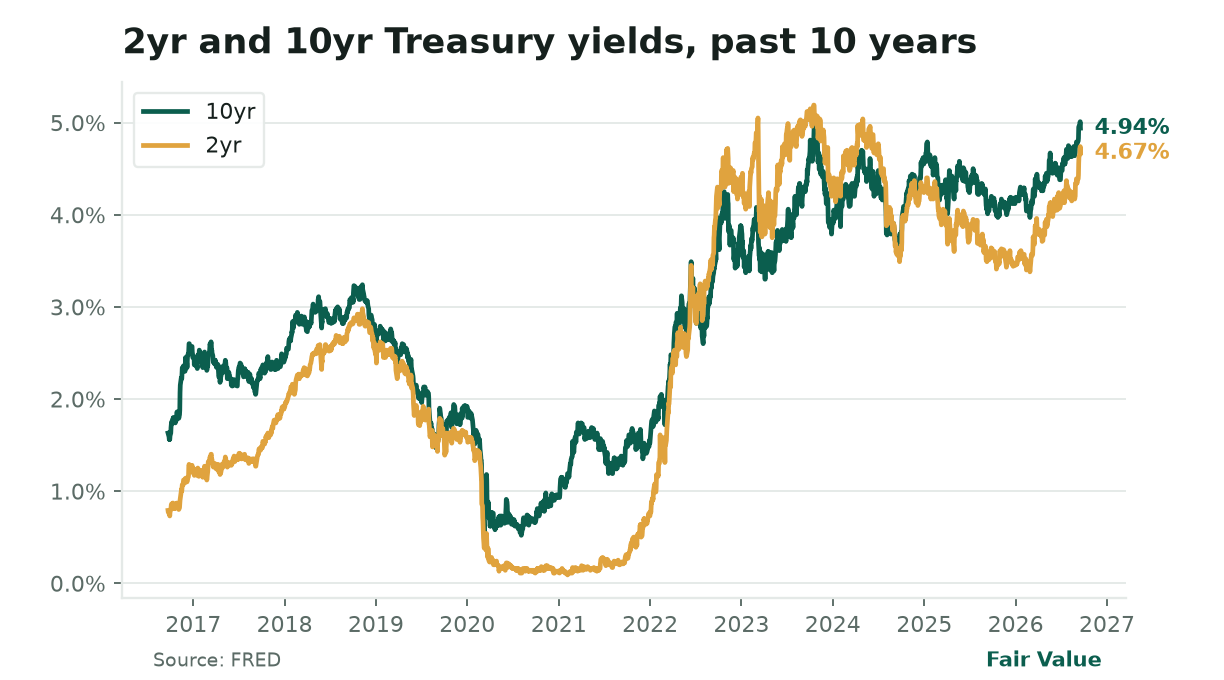
The Fed hiked to 3.75-4.00% and signaled one more increase, yet the 10-year yield at 5.01% and a 27-basis-point 2s10s spread show the bond market tightening financial conditions through the long end, not the short end.
▸
Brent crude swung from $130 to $99 in eight days as Saudi pipeline hopes briefly eased the Hormuz-Red Sea supply squeeze, but tanker rates remain at record highs and both chokepoints are still contested.
▸
Crypto was the only market open all weekend: Bitcoin held near $80,500 (+4.7% on the week), Ethereum above $2,580, and Solana +9% weekly, but volume is thinning and the Fear & Greed index sits at "greed," a level that often precedes a pullback.
The week that was
The Federal Reserve's September 15-16 meeting delivered a unanimous 25-basis-point hike to 3.75-4.00%, the first since July 2023, and the dot plot shifted meaningfully hawkish: the median 2026 year-end projection rose to 4.1% from 3.8% in June, implying one more hike, while core PCE inflation isn't seen returning to 2% until 2029. Chair Kevin Warsh called the move "removing a dose of accommodation" and said he was "hard-pressed to describe broad financial conditions as restrictive." The bond market's reaction told the real story: the 10-year Treasury yield closed Friday at 5.01%, the 30-year at 5.35%, and the 2s10s spread compressed to 27 basis points.
Spread at 27 bps, its tightest since early 2000. Today the 10‑yr sits at 5.01% and the 2‑yr at 4.74%, a gap last seen in early 2000 before the dot‑com bust, after which yields fell and a recession followed.
That flattening curve is global, Japanese 10-years at 2.94%, German Bunds at 3.18%, UK gilts at 4.99%, signaling a synchronized sovereign duration selloff driven by term premium and fiscal sustainability fears, not Fed policy expectations.
The transmission to housing is already mechanical. The 30-year fixed mortgage rate hit 6.95%, the highest since 2008, as mortgages price directly off the 10-year Treasury. Building permits (1.394 million annualized) now exceed housing starts (1.275 million) by 5%, creating a 12-18 month supply pipeline.
New-home sales have fallen 8% year-over-year to 607,000, well below the five-year average of ~720,000. The lock-in effect, existing owners with sub-4% mortgages refusing to sell, combines with builder rate buydowns that only mask the affordability hole. Every percentage-point rise in mortgage rates reduces purchasing power by roughly 10%; at 6.95% versus the 5% five-year average, the marginal buyer is priced out. Construction employment turns with a 6-9 month lag; consumption follows.
Norway's $2.3 trillion sovereign wealth fund formally proposed cutting its U.S. Treasury allocation from 34.1% to 21.9% of its bond benchmark, roughly $80 billion in sales, shifting toward Japanese government bonds, corporate debt, and agency mortgage-backed securities. The move requires Ministry of Finance and parliamentary review, with a decision expected by spring 2027. It is the largest single institutional signal yet that reserve managers are diversifying away from U.S. government debt.
Equity markets digested the week divergently: the Nasdaq-100 rose 1.8% led by semiconductors (ARM +4.0%, Micron +3.9%, ASML +3.1%), but breadth narrowed, Qualcomm fell 5.8%, AMD rose only 2.7%. The S&P 500 was flat (-0.08%), the Dow dropped 1.7%, and the Russell 2000 fell 1.5%. Financials (-2.4%), utilities (-3.0%), and consumer discretionary (-1.7%) lagged. The VIX dropped 6.5% to 14.81, a seventh-percentile reading suggesting complacency even as sector rotations accelerate.
China's rare-earth suppliers continue to halt shipments to U.S. companies following Beijing's August sanctions on the Responsible Business Alliance, while anti-dumping controls on dichlorosilane imports from Japan require cash deposits up to 99.2%. Yet Chinese exports surged 9.2% year-over-year in August. Canada-U.S. retaliatory tariffs took effect September 8, targeting steel, dairy, agricultural equipment, and electronics on both sides.
The big question this week
Can the global long-end duration selloff sustain itself without a growth scare, and what breaks first?
The strategist's read in Friday's edition laid out the chain: a synchronized global sovereign selloff has pushed up term premium because investors demand more compensation to hold long-dated debt. Fiscal deficits above 6% of GDP in the U.S., rising debt service costs, and a potential reversal of the global savings glut are the debated drivers.
The 10-year at 5.01% translates to a 6.95% mortgage rate, the highest since 2008, which has already frozen housing turnover. Permits exceed starts; new-home sales are plummeting; builder inventories will swell into 2027. The Fed sees "policy restrictive enough" at 3.75-4.00%, but the long end is tightening for them with a lag that hits housing first, consumption second, labor third.
The sharper edge professionals debate: if the term premium rise reflects fiscal sustainability fears, long yields stay high even if the Fed cuts, a "higher for longer" at the back end, not the front. That would make 6.5%+ mortgages structural, permanently raising the floor on housing costs and altering the neutral rate calculation. The confirm/refute test: watch for the 10-year sustaining above 5.00% with the 2s10s spread below 50 basis points AND new-home sales falling below 580,000 annualized. Refutation: 10-year drops below 4.70% with 2s10s steepening above 75 basis points, or new-home sales rebound above 650,000.
This week's data will test the thesis. Australian employment (Wednesday) and U.S. PMIs (Wednesday) give early reads on whether the global growth impulse is cracking. The SNB decision (Thursday) tests whether a central bank with 0.8% inflation holds rates at 0.00%, a reminder that not every economy is in the same boat. And the University of Michigan consumer sentiment final (Friday) will show whether the preliminary plunge to 47.8 (second-lowest on record) holds, as inflation fears and Middle East conflict weigh on households.
The week ahead
Monday, September 22
▸
RBA Governor Michele Bullock speaks — , She warned last week that "stubborn inflation concerns are materializing" and energy prices will keep inflation elevated. Money markets have nearly fully priced in an RBA rate increase this month. Why it matters: Australia is a bellwether for China-linked commodity demand; a hike signals the RBA sees inflation risk outweighing growth risk.
Wednesday, September 23
▸
Australian employment change (forecast +20.9K, prior -15.8K) and unemployment rate (forecast 4.5%, prior 4.5%) — , July saw the first monthly employment drop since April, driven by a 32,200 decline in part-time work. Why it matters: A second weak print would challenge the RBA's tightening case; a strong rebound would cement a September hike.
▸
Costco (COST) earnings after close — , Consensus: $6.55 EPS, $94.85B revenue (+10% YoY). Options imply a ±3.9% post-earnings move. Why it matters: Costco's membership renewal rates and traffic are a real-time gauge of U.S. consumer resilience at the upper-middle tier.
▸
Flash PMIs for Germany, Eurozone, UK, and U.S. — , Why it matters: The first look at September activity; manufacturing has been contracting in Europe, services holding. Any further weakness feeds the "long end tightening = growth scare" narrative.
Thursday, September 24
▸
SNB policy decision (expected hold at 0.00%) — , Swiss inflation at 0.8% YoY in August, within the 0-2% target. Why it matters: The SNB is the outlier, cutting or holding while others hike. If they intervene to weaken the franc, it signals concern about export competitiveness.
▸
BOE Governor Andrew Bailey speaks — , He said September 17 the outlook is "too unpredictable" to comment on market pricing of nearly four hikes. Why it matters: The BOE's next move hinges on whether UK services inflation stays sticky; Bailey's tone sets the pace.
Friday, September 25
▸
University of Michigan consumer sentiment final (preliminary 47.8, second-lowest on record) — , The preliminary reading plunged 7.5% from August on inflation fears and Middle East conflict. Why it matters: Consumer spending is ~70% of U.S. GDP. If sentiment stays this depressed, the consumption leg of the housing→consumption→labor chain weakens faster.
Federal Reserve speakers throughout the week, At least 10 appearances, including Governor Barr (housing, Monday/Tuesday), Vice Chair Jefferson (Treasury market functioning, Wednesday), and Vice Chair for Supervision Bowman (stress testing, Thursday in London). Why it matters: Post-FOMC messaging will clarify whether the "one more hike" dot-plot signal is firm or data-dependent.
Worth knowing: Housing transmission
The mortgage payment on a median-priced U.S. home has jumped sharply since early 2022, not because the Fed raised rates eight times, but because the 10-year Treasury yield climbed from 1.5% to 5.0%. That long-bond move passed straight through to the 30-year fixed mortgage. The Fed's policy rate matters, but the 10-year is the true transmission belt for housing.
Here's how the machine works. When you take out a 30-year mortgage, the bank doesn't fund it with deposits, it sells the loan into the agency mortgage-backed securities (MBS) market, where the price is set by the 10-year Treasury yield plus a spread for prepayment risk.
So when global investors demand higher yields on long-dated sovereign debt (because they're worried about deficits, inflation, or a savings-glut reversal), the 10-year rises, MBS yields rise, and your mortgage rate rises, regardless of what the Fed does with the overnight rate. This is the "transmission: rate to your life" chain: policy rate → financial conditions → long yields → mortgage rates → affordability → housing activity → construction jobs → consumption → GDP.
The lock-in effect amplifies the damage. A majority of outstanding mortgages carry rates well below current levels. Those owners won't sell because they'd have to give up a cheap loan for an expensive one. So existing inventory stays frozen while builders keep pulling permits above starts.
The gap means completions will rise into 2027 even as demand collapses, a supply overhang that forces price concessions or production cuts. Construction employment, currently resilient, turns with a 6-9 month lag. This is housing as the cycle's first domino, a pattern we saw in 2006-2007 and 1989-1990.
Remember the yield-price seesaw: when yields rise, bond prices fall. The same math applies to MBS, higher yields mean lower MBS prices, which means higher mortgage rates for new borrowers. And recall "real estate as an asset": housing is the largest asset on most household balance sheets, and its financing cost is set at the long end of the curve, not the short end.
Why this matters to your money right now: if you're renting, the supply overhang may eventually soften rents as completions hit a market with fewer qualified buyers. If you own, your home's value is supported by the inventory lock-in, but your HELOC rate (tied to the prime rate, which tracks the Fed) and your ability to trade up are constrained. If you're saving for a down payment, a 7% mortgage rate means you need significantly more income to qualify for the same loan you'd have gotten at 5%.
Concept 64 of 83 in the Fair Value course.
Tomorrow's question: RBA Governor Bullock speaks Monday. If her tone is more hawkish than expected, what does that do to Australian 2-year yields, the AUD/USD, and, via the global duration channel, the U.S. 10-year? We'll walk through the answer tomorrow.
Not financial advice. This brief is for informational and educational purposes only and does not constitute investment advice or a recommendation to buy or sell any security.
Data: macro indicators per FRED® (Federal Reserve Bank of St. Louis); not endorsed or certified by the Federal Reserve Bank of St. Louis. Energy data per the U.S. Energy Information Administration (EIA). Auction data per U.S. Treasury Fiscal Data. Filings per SEC EDGAR. Market prices per Yahoo Finance. Earnings calendar per Financial Modeling Prep. Crypto data per Binance. World events per GDELT and WSJ.