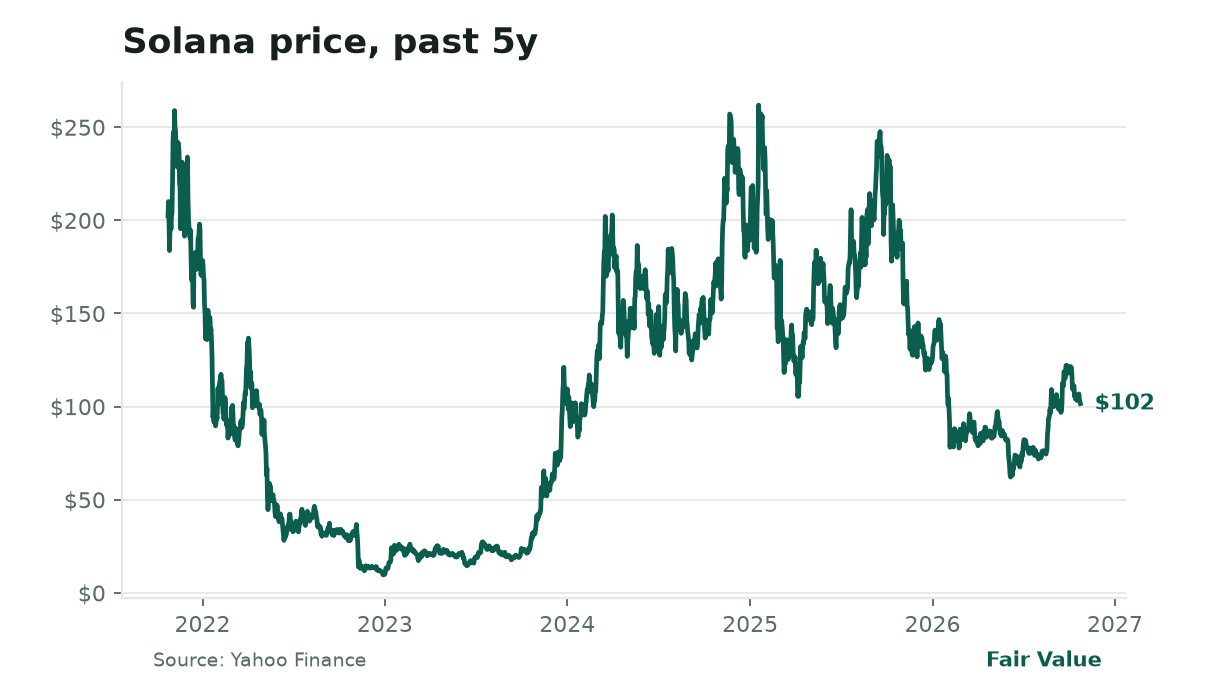
Solana's Alpenglow upgrade went live Friday, cutting transaction finality from ~13 seconds to ~150 milliseconds, a structural speed boost that could make SOL competitive for payments and high-frequency DeFi, not just meme trading.
▸
Brent crude climbed to $116.72 while the broad dollar sits at a multi-decade high of 121.4, the two usually move opposite. Physical oil scarcity is now strong enough to override the dollar's normal dampening effect, coiling a spring: if the Fed pivots and the dollar falls, oil could spike another $15-20 without any new supply shock.
▸
Fitch warned the U.S. sovereign rating faces downgrade risk as the deficit hit $1.99 trillion and interest payments topped $1 trillion, making Treasuries a weaker hedge against stocks than at any point since 1996 (correlation 0.82).
The big story
The Strait of Hormuz is effectively closed. As of Friday, only four commercial vessels transited the chokepoint that normally handles 85 per day, a 95% collapse. Iran's Revolutionary Guard claims a total halt on "non-compliant" ships after mining the channel and striking tankers. Simultaneously, Houthi missiles are hitting Saudi airports and Aramco facilities deep inside the kingdom, and the U.S. has ordered personnel out of Saudi Arabia.
This isn't another Red Sea disruption. It's a dual-chokepoint stranglehold: Hormuz (20% of global oil, 25% of LNG) blocked from the east, Bab al-Mandab contested from the west. Saudi Arabia's East-West Pipeline, the 5 mb/d bypass built for this scenario, has been attacked twice in six weeks.
The physical market is screaming: dated Brent spot traded at $115.22 on October 20, a $12 premium to futures. That backwardation is the steepest in decades. VLCC rates on the Middle East-to-Asia route have doubled to $1.3 million per day.
Yet the dollar sits at 121.4 on the Fed's broad trade-weighted index, near a multi-decade high. Normally a 10% dollar rise cuts dollar-oil prices 5-7%. Here the dollar is up 3.4% in six months while Brent is up 21% in three.
The inverse relationship has broken. The market is pricing a war risk premium on top of structural scarcity: OPEC+ spare capacity is ~3.5 mb/d, the lowest since 2020; global OECD inventories are below the five-year average even as U.S. stocks sit comfortably above it.
Here's the convexity trap the Fed may not be modeling. The 10-year TIPS breakeven sits at 2.32%, anchored, calm. The Fed sees "easy" financial conditions (NFCI at -0.496) and prices a December hike. But if the dollar weakens just 5% on a pivot (DXY to ~97), the same physical tightness could push Brent to $130+ without any new supply shock.
That would add 0.3-0.4 percentage points to headline CPI via gasoline, diesel, and jet fuel, forcing the Fed to resume hiking into a slowing economy. A classic 1970s policy error, coiled and waiting. The housing channel (30-year mortgage at 7.32%) and credit channel (HY OAS 3.4%) are already restrictive. A second inflation wave would deepen real-economy damage while the VIX at 19.45 and NFCI at -0.496 look deceptively loose because they're equity-volatility weighted.
Watch the Brent/DXY cross-rate. If Brent holds above $110 while DXY falls below 100, the trap springs. Confirm via weekly EIA crude draws >2 million barrels for three consecutive weeks alongside dollar index decay.
What's going on today
That physical-market scream showed up in Friday's prices. Equity and bond markets are closed for the weekend, Friday's session was the last word until Monday. The S&P 500 closed at 7,624, down 0.5% on the day and 1.1% for the week, while the Nasdaq-100 slipped 0.8% weekly.
But the real action was underneath: semiconductors suffered their worst single-day rout in months Thursday, with seven major chip names falling 6-9% and the SOXX ETF down 16.9% in a month. Meanwhile, software (IGV +26% in three months), consumer staples (XLP +9% monthly), and healthcare (XLV +7%) hit new highs, a surgical rotation out of AI infrastructure and into earnings visibility.
Oil told a different story. Brent surged 3.1% Friday to $116.72, up 21% in three months and 77% year-over-year. WTI climbed 3.8% to $103.27. Natural gas collapsed 5.6% to $2.64, down 20% in a month, a stark divergence showing U.S. gas oversupply while global oil is structurally tight. Gold fell 1.3% to $4,008 and silver dropped 1.9% to $53.71, both down sharply for the week as rising oil reignited inflation fears and tech weakness triggered margin calls on precious metals positions.
In crypto, Bitcoin traded around $80,500 (-0.7% on the day, -4.5% monthly) and Ether at $2,360 (-1%, -12% monthly). But Solana's Alpenglow upgrade went live Friday, overhauling its consensus to cut finality from ~13 seconds to ~150 milliseconds, a structural leap that could make SOL viable for payments and high-frequency DeFi, not just speculation. Stablecoin supply sits at $303 billion, flat for a year. The OCC finalized stablecoin redemption rules under the GENIUS Act (effective January 2027), and the SEC proposed "Regulation Crypto Assets" with tailored exemptions for digital asset offerings.
SOL price near 5‑year high. SOL trades at $101.5, its highest since early 2022 ($102); the last time it hovered around $100 in 2022 a sharp correction followed, wiping out roughly 30% of value over six months.
Geopolitically, Russia and Ukraine agreed to a U.S.-brokered ceasefire in one embattled town with peace talks next month. Trump rolled back some Canada tariffs ahead of midterms. Fitch warned the U.S. sovereign rating faces downgrade risk as the deficit hit $1.99 trillion and net interest payments topped $1 trillion, making Treasuries correlate 0.82 with the S&P 500, the highest since 1996, weakening their hedge value.
The big picture
Beneath the headline moves, the bond market prices a growth scare while the Fed prices a hike. The 10-year Treasury yield dropped to 4.96% Friday (from 5.13% a week ago), falling below 5% for the first time in a month. The 2-year fell to 4.65%.
The 10-year/3-month spread narrowed to 0.78 percentage points, a classic pre-stress signal. Yet CME FedWatch shows 80-90% odds of a 25-basis-point hike in December. The market thinks the Fed will hike into a slowdown because inflation (headline CPI 3.72%, core 2.57%) stays sticky, driven partly by energy.
The dollar is the transmission mechanism. At 121.4 on the broad trade-weighted index, it's tightening global financial conditions by an estimated 50-75 basis points of implicit tightening, meaning the Fed's "steady" stance is actually restrictive for the world. This compresses the ~40% of S&P 500 earnings sourced abroad, crushes emerging-market currencies and equities (Hang Seng -7% monthly, Nikkei -4%), and lowers import prices enough to mask domestic inflation pressure. But it also makes dollar-denominated oil more expensive for foreign buyers, which should suppress demand, except physical scarcity is overriding that channel.
Equity breadth is deteriorating beneath the surface. Only 56% of S&P 500 stocks trade above their 200-day moving average (below average), and the RSI sits at 45, weakened momentum without being oversold. The VIX at 19.45 is up 28% monthly but still near its long-run median, giving the Fed cover to stay hawkish.
Software rallies on AI monetization hopes despite rate headwinds. The iShares Expanded Tech-Software ETF (IGV) surged 26% in three months to 110.6 (Oct 23), led by extreme moves in ServiceNow (+61%), Salesforce (+52%), and Microsoft (+38%), all at or near multi-year highs, yet the index remains 6% below its September 2025 peak and 4% below year-ago levels. The rally reflects a rotation from semiconductors (SOXX −27% from highs) into the AI application layer: hyperscalers' $601B capex run-rate (TTM to Sept 2026, +83% YoY) is increasingly funding enterprise AI services, copilots, and data platforms where software vendors capture recurring, high-margin revenue.
Microsoft's Azure guide of ~45% constant-currency growth (Q1 FY27, reported Oct 28) and Meta's EPS beat signal demand durability. Software's free-cash-flow resilience, unlike capex-heavy chipmakers and hyperscalers whose aggregate FCF fell 43% to $109B, attracts flows despite 10-year yields at 4.96% and a 40.4× Shiller CAPE. Continuation requires sustained AI attach-rate expansion in enterprise contracts and no Fed hike beyond December's priced 25bp; reversal risks include hyperscaler capex deceleration, enterprise budget cuts if unemployment (4.2% Sept) rises, or yields breaking sustainably above 5%.
Around the world
The dollar's transmission mechanism doesn't stop at U.S. borders. The Middle East dual-chokepoint crisis dominates. Iran has effectively closed the Strait of Hormuz to commercial shipping, 4 vessels transited October 18 versus a normal 85. Dated Brent spot at $115.22 carries a $12 backwardation over futures, the steepest in decades, signaling desperate near-term demand for physical barrels. VLCC rates have doubled to $1.3 million/day.
Houthi missiles struck King Fahd Airport in Dammam (killing two), Abha airport, the Saudi Defense Ministry in Riyadh, and an Aramco facility in Yanbu, the deepest strikes yet into Saudi territory.
Saudi Aramco evacuated its Dhahran headquarters. The U.S. ordered personnel departures. Britain deployed fighter jets to Saudi Arabia. This is no longer a shipping disruption; it's a regional war threatening 20% of global oil supply.
Russia and Ukraine agreed to a U.S.-brokered ceasefire in one frontline town with broader peace talks next month, the first concrete diplomatic movement since the UAE-hosted trilateral talks resumed. Putin agreed to resume talks; Zelenskyy confirmed the format. Whether this holds or becomes another frozen conflict remains the swing factor for European energy and defense spending.
China opened a new anti-dumping investigation into EU imports days before Trade Commissioner Šefčovič's Beijing talks, escalating friction ahead of a November deadline. China also announced sanctions on Taiwanese entities restricting financial and shipping links, while cutting tariffs on U.S. farm goods (excluding soybeans). The Taiwan Strait rhetoric is escalating alongside trade negotiations, Xi raised Taiwan directly with Trump; Taipei called Beijing the "true disruptor."
The ECB holds at 2.5% deposit / 2.65% refi, but Eurozone headline inflation hit 3.72% year-over-year in September, a three-year high. Core is 2.57%. The Governing Council is data-dependent; if inflation stays above 3.5% through November, a December hike is priced. French borrowing costs are spiking on fiscal concerns, complicating the ECB's anti-fragmentation calculus.
Japan's BOJ remains at ~0.25% but policymakers are openly debating a second hike. The 375-basis-point Fed-BOJ differential sustains the yen carry trade (USD/JPY at 156.8). Governor Ueda warned underlying inflation must not exceed 2%; Himino signaled readiness to raise costs. A BOJ hike would unwind the carry trade, strengthen the yen, and relieve some dollar pressure, but could also trigger a risk-off move that strengthens the dollar anyway.
Companies making news
Corporate boards are reading the same signals. Solana activates Alpenglow upgrade, slashing finality to ~150ms. The network went live Friday with its "Votor" consensus protocol, replacing TowerBFT. Transaction finality drops from ~12.8 seconds to ~150 milliseconds, an 85x speedup.
This structural change targets payments, high-frequency DeFi, and real-world asset settlement. SOL traded at $101.50 (-1.4% daily, +36% quarterly) but remains 61% below its January 2025 peak. Volume on the move was light (24h volume 37% below 7-day average), suggesting the upgrade is priced as infrastructure, not catalyst.
Meta's Muse AI agent hits 10 million downloads in six weeks. The consumer-facing agent, launched early September, is scaling faster than ChatGPT's initial adoption. But the payoff question remains: Meta's Q3 2026 free cash flow turned negative $2.1 billion (from +$10.6 billion a year earlier) as capex surged to $135-145 billion projected for 2026. AI-driven ad targeting boosted revenue 19% year-over-year in Q3 2024, but the infrastructure bill is now consuming 84% of hyperscaler operating cash flow industry-wide. The market is scrutinizing whether agent adoption translates to monetization before the capex wall hits.
American Express cuts 5% of headcount in AI push. AmEx joins Comcast ($1B restructuring charge) and Netflix (Bay Area cuts) in pre-emptive layoffs. Goldman estimates AI could displace 1 in 11 workers. The financial sector is front-running the displacement cycle, but layoffs this early in an expansion (unemployment 4.2%) signal corporate caution about the revenue side of the AI equation.
SK Hynix scraps U.S. IPO for flash-memory subsidiary. The Korean chipmaker cited market conditions. The SOXX ETF is down 27% from its 52-week high; ARM -37% monthly, Intel -31%. Semiconductor supply-chain constraints (Lam Research warning December-quarter revenue capped at $8.6B despite record Q3) are colliding with investor skepticism on AI capex payback.
JetBlue creditors hire PJT Partners and Akin Gump. Senior creditors are preparing for restructuring as shares and bonds sink. The airline never recovered post-pandemic capacity; the move signals distress spreading beyond regional carriers into majors.
Norway's sovereign wealth fund lost $29.7 billion in Q3. The world's largest fund ($1.6T) was hit by rising rates on its bond portfolio, though energy gains offset some. A signal that even the most patient capital is taking mark-to-market pain on duration.
CRH completes $8.5B Arcosa acquisition. Building materials consolidation continues; infrastructure spending (IIJA, CHIPS Act) provides multi-year visibility. Nordson buys Contrinex for factory automation sensors. Rivian acquires Third Dimension AI for autonomous driving simulation. Deal flow persists in industrials and autonomy despite rate headwinds.
From Washington
Policy makers are watching the same dashboards. The Fed is in its blackout period ahead of the October 27-28 FOMC. Markets price 9-16% chance of a hike this meeting, 80-90% for December. The September minutes showed officials cited hyperscaler AI capex ($601B trailing, +83% YoY) as adding to input-cost inflation pressures, a rare explicit link between tech spending and monetary policy.
Fitch's downgrade warning is the louder signal. The U.S. deficit hit $1.99 trillion in FY2026 (+12% YoY, largest since 2021). Net interest payments reached $1.05 trillion, now one of the top three federal spending categories.
The Treasury/TIPS correlation with the S&P 500 at 0.82 (highest since 1996) means the traditional 60/40 portfolio hedge is degrading. If Fitch follows through, long-term yields rise, mortgage spreads widen (already 230bp over the 10-year), and the fiscal-monetary feedback loop tightens.
The Justice Department closed its inquiry into the Fed, removing a political risk factor. The Treasury proposed expanded restrictions on U.S. high-tech investments (supercomputing, biotech, hypersonics, AI) to "countries of concern", China, Russia, North Korea, broadening the 2023 outbound investment screening regime. This could slow venture capital flows to dual-use tech and increase compliance burdens.
Trump rolled back some Canada tariffs in a bid to boost Senator Susan Collins in Maine, a midterm-economy intersection. The tariffs being removed are targeted; replacement tariffs on other products are expected. The net trade-policy direction remains protectionist but tactically flexible.
Under the hood
The Fed's blackout period gives us space to trace the mechanism ourselves. Physical oil tightness is overcoming historic dollar strength, coiling a convexity trap where any Fed pivot triggers a second inflation wave through energy.
The chain: Commodities-energy (physical oil scarcity) → Inflation (energy CPI weight ~7.5% via gasoline/diesel/jet) → Rates-Fed (hawkish bias, Dec hike priced) → FX-Global (strong dollar at 121.4 broad index) → Commodities-energy (dollar normally suppresses oil, but physical floor holds) → [On Fed pivot] FX-Global (dollar reverses) → Commodities-energy (oil surges unhedged) → Inflation (re-acceleration) → Rates-Fed (forced back to hike).
The numbers reveal the tension: Brent at $116.72 with the broad dollar at 121.4 implies a real oil price in foreign-currency terms that is historically extreme. Normally a 10% dollar appreciation cuts dollar-oil 5-7%; here the dollar is up ~3.4% in six months while oil is up 15.6% in three. The physical market confirms tightness: U.S. crude inventories at 415M barrels are above the 5-year average but global OECD stocks are below, and OPEC+ spare capacity is ~3.5M bpd, lowest since 2020. Natural gas at $2.64/MMBtu (-20% monthly) shows the divergence: gas is regional (U.S. oversupplied), oil is global (structurally tight).
The Fed's models assume oil and dollar move inversely, so a 2.32% 10-year breakeven looks anchored. But if the dollar weakens 5% on a pivot (DXY to ~97), the same physical tightness could push Brent to $130+ without any new supply shock, adding 0.3-0.4pp to headline CPI and forcing the Fed to resume hiking, a classic 1970s-style policy error. The housing channel (30-year mortgage at 7.32%) and credit channel (HY OAS 3.4pp) are already restrictive; a second inflation wave would deepen real-economy damage while financial conditions indices (NFCI -0.496, VIX 19.45) remain deceptively loose because they're equity-volatility weighted.
The sharper edge: Professionals are debating whether the oil strength is geopolitical risk premium (transient) or structural underinvestment (persistent). The shipping-cost alarm, VLCC rates doubling, suggests physical arbitrage is strained, supporting the structural view. The live question: does the Fed's reaction function incorporate the convexity that a 5% dollar decline could add 0.4pp to CPI via oil alone, or will they treat any pivot-induced oil spike as "supply-side" and look through it?
Watch: Brent/DXY cross-rate. If Brent holds above $110 while DXY falls below 100, the convexity trap is sprung. Confirm via weekly EIA crude draws >2M bpd for three consecutive weeks alongside dollar index decay.
The long view: Why are US mega-cap tech and AI stocks valued as highly as they are when the AI build-out is not yet showing up as profit?
That same capex cycle driving the oil-dollar trap is also reshaping tech valuations. Answer: The market is pricing a platform shift, not current earnings, and using the only yardstick that works for platform shifts: replacement cost of the infrastructure layer.
The five hyperscalers (Microsoft, Google, Amazon, Meta, Oracle) spent $601 billion on capex in the trailing twelve months, up 83% year-over-year, consuming 84.7% of operating cash flow and collapsing free cash flow 43% to $109 billion from $191 billion. Oracle alone spent 105% of revenue on capex. Nvidia's data center revenue hit $89 billion last quarter (+117% YoY), but that's their revenue, not the hyperscalers' profit. The hyperscalers are building the rails before the trains run.
What changed since last edition: The semiconductor rout (SOXX -27% from high) forced a repricing of the infrastructure layer while the application layer (software, IGV +26% quarterly) held. This bifurcation is the market saying: "We believe in AI demand, but we're skeptical the chip makers capture the value." Meanwhile, Meta's Muse agent hit 10M downloads in six weeks, faster than ChatGPT's initial adoption, proving consumer pull exists. But Meta's FCF turned negative $2.1B in Q3 2026 on $135-145B projected 2026 capex. The monetization lag is real.
The valuation mechanism: Shiller CAPE at 40.36 (99th percentile since 1871). S&P 500 trailing P/E 26.0. Megacap basket forward P/E 21.3. These multiples only make sense if AI delivers a productivity inflection that lifts trend growth from ~1.8% to ~2.5%+, the "J-curve" where capex depresses earnings now but enables a step-change in margins later.
The 10-year real yield at ~2.6% (5.13% nominal minus 2.32% breakeven) is the discount rate. If real yields stay here, the equity risk premium must widen, implying 10-15% lower fair value. If AI productivity arrives, the denominator (growth) expands and the multiple holds.
What would change the view: (1) Two consecutive quarters of hyperscaler FCF stabilization (capex growth < revenue growth), (2) 10-year real yield breaking above 3% without growth acceleration, (3) A major hyperscaler guiding capex down for 2027. Until then, the market is pricing the option value of the platform shift, expensive, volatile, and path-dependent.
Worth learning today: Cash, T-bills, and "risk-free", the duration trap
For individual savers, the trap takes a different form. Quick check: Why would a hot CPI print push mortgage rates up? Because mortgage rates track the 10-year Treasury, and hot inflation → Fed hikes → higher long-term yields → higher mortgage rates. The chain is CPI → Fed → 10-year → mortgage.
We taught this 88 days ago: "risk-free" means default-risk-free, not loss-proof. Today's deeper lesson: cash has duration risk when inflation runs above the risk-free rate.
A 3-month T-bill yields ~4.6% (the Fed's target range upper bound). Core CPI is 2.57%. Core PCE is 3.01%.
In real terms, you're earning ~1.5-2%, positive, but thin. The trap appears when you roll that bill.
If the Fed hikes in December (80% priced), the new bill yields ~4.85%. But if inflation re-accelerates to 3.5% (the oil convexity trap), your real yield drops to 1.35%. You're not losing nominal dollars, you're losing purchasing power slowly, compounded quarterly.
Contrast with a 10-year TIPS at 2.32% real yield. Lock in 2.32% above inflation for a decade. The trade-off: you give up liquidity and take mark-to-market volatility (the 20y+ UST ETF is down 7.7% from its high). But you eliminate reinvestment risk, the risk that future bills yield less in real terms.
The sharper edge: Money-market funds (the retail wrapper for T-bills) have $6.5T in assets. They're "cash" to most savers. But their weighted average maturity is ~30-60 days. Every roll is a bet that the Fed's next move isn't a pivot into sticky inflation.
If the convexity trap springs (dollar falls, oil spikes, CPI re-accelerates), money-market yields will lag inflation for quarters, a slow-motion real loss that doesn't show up on a statement until you try to buy groceries.
TL;DR: "Risk-free" is a nominal concept. In real terms, short-term cash carries reinvestment risk; long-term TIPS carry duration risk. Pick your poison, but know which one you're holding.
What to watch this week
▸
Monday, Oct 26 — , Verizon (VZ) earnings pre-market. EPS est. $1.27. Watch for Starlink competitive commentary and FWA subscriber growth.
▸
Tuesday, Oct 27 — , FOMC meeting begins (two-day). Blackout in effect. Markets price 9-16% hike chance; 80-90% for December.
▸
Wednesday, Oct 28 — , FOMC statement + Powell press conference (2pm ET). The only event that can move the dollar/oil convexity trap.
▸
Thursday, Oct 29 — , Microsoft, Google, Amazon, Intel, Ford, FedEx earnings. Hyperscaler capex guidance for 2027 is the key read-through for AI build-out sustainability.
▸
Friday, Oct 30 — , Exxon, Chevron, AbbVie earnings. Energy sector FCF and buyback signals at $116 Brent.
▸
Treasury auctions: — 2-year (Mon), 5-year (Mon), 7-year (Thu), plus bills throughout the week. Bid-to-cover ratios will show if Fitch warning is affecting demand.
Not financial advice. This brief is for informational and educational purposes only and does not constitute investment advice or a recommendation to buy or sell any security.
Data: macro indicators per FRED® (Federal Reserve Bank of St. Louis); not endorsed or certified by the Federal Reserve Bank of St. Louis. Energy data per the U.S. Energy Information Administration (EIA). Auction data per U.S. Treasury Fiscal Data. Filings per SEC EDGAR. Market prices per Yahoo Finance. Earnings calendar per Financial Modeling Prep. Crypto data per Binance/DefiLlama/CoinGecko. Geopolitical and corporate news per WSJ, GDELT, and discovery sweeps.