|
Fair Value
Friday, November 20, 2026
|
| |
| ▸ | The S&P 500 fell for a sixth straight session, its longest losing streak since April 2024, as Anthropic's record $81 billion IPO failed to halt the AI selloff; the Nasdaq-100 is down 10% for the month and semiconductors have shed 21% in three months. | | ▸ | The 30-year mortgage rate jumped 25 basis points to 7.28% on Thursday, the highest since 2001, as the bond market priced in persistent inflation and a Federal Reserve that may keep rates restrictive longer; the 10-year Treasury yield sits at 5.07% with the 2-year at 4.8%, compressing the spread to 28 basis points. | | ▸ | Natural gas surged 9.8% Thursday to a six-month high while Brent crude has collapsed 19% in a month to $87.89, a structural divergence where record LNG export flows tie U.S. heating and power prices to global demand even as Middle East supply disruptions fail to support oil. |
|
| | | The big story Anthropic went public Thursday in the largest IPO in history, $81.3 billion raised at a $1.4 trillion valuation, and the AI trade sold off anyway. The Nasdaq Composite dropped 2.3%, its sixth consecutive decline, while the Philadelphia Semiconductor Index has fallen 21% in three months and 37% from its June peak. Nvidia has shed 32% in a month. AMD fell 7.7% Thursday alone. Marvell is down 42% in a month. The VIX jumped to 29.6, up 53% for the week. The contradiction is the story. Anthropic's debut was supposed to validate the sector: the first frontier AI lab to list, pricing above its marketed range at $83 per share, opening at $111.50. Instead it became a "sell the news" catalyst. By Thursday's close Anthropic traded at $97.17, and the broader market took the IPO's failure to spark a rally as confirmation that AI valuations have disconnected from near-term cash-flow reality. The numbers the market is now staring at: the five hyperscalers deployed $691 billion in capital expenditure over the trailing twelve months, up 94% year-over-year, consuming 95.5% of operating cash flow. Aggregate free cash flow collapsed to $33 billion from $201 billion a year earlier. Amazon's long-term debt doubled to $181 billion in six months to fund a $220 billion annual capex pace. Nvidia's supply commitments hit $279 billion as of July, heavily memory-weighted with take-or-pay terms. The Wall Street Journal reported Friday that over $500 billion in promised financing for Nvidia customers from six major banks has not deployed a single dollar. The Fed's October minutes revealed policymakers explicitly worried about "AI-related debt" growing through "complex and opaque financing structures," "off-balance-sheet leasing commitments," and "circular financing arrangements among AI-related firms." Governor Waller said Thursday that if core CPI runs near 0.3%, a 50-basis-point hike in December "should be considered." The 10-year yield at 5.07% and the 2-year at 4.8% leave a 28-basis-point spread, a level that historically precedes growth scares. The AI trade isn't just a sector rotation. It's the marginal buyer of the entire risk complex. When the only company with visible earnings (Nvidia) loses a third of its value in a month while its customers burn cash at an unprecedented rate, the signal is that the marginal dollar of speculative risk appetite has been exhausted. The VIX at 29.6, the mortgage rate at 7.28%, the dollar at a 19-month high (DXY 103.9), and gold down 23% in three months all say the same thing: liquidity is draining, and the most crowded trade, long AI, short volatility, short dollar, is unwinding. |
| | | What's going on today Thursday's session was broad-based risk-off: the S&P 500 fell 2.0% to 7,176, the Nasdaq-100 dropped 2.2% to 26,517, and the Dow lost over 1,100 points. All eleven S&P sectors finished lower, led by consumer discretionary (-2.8%) and technology (-2.1%). 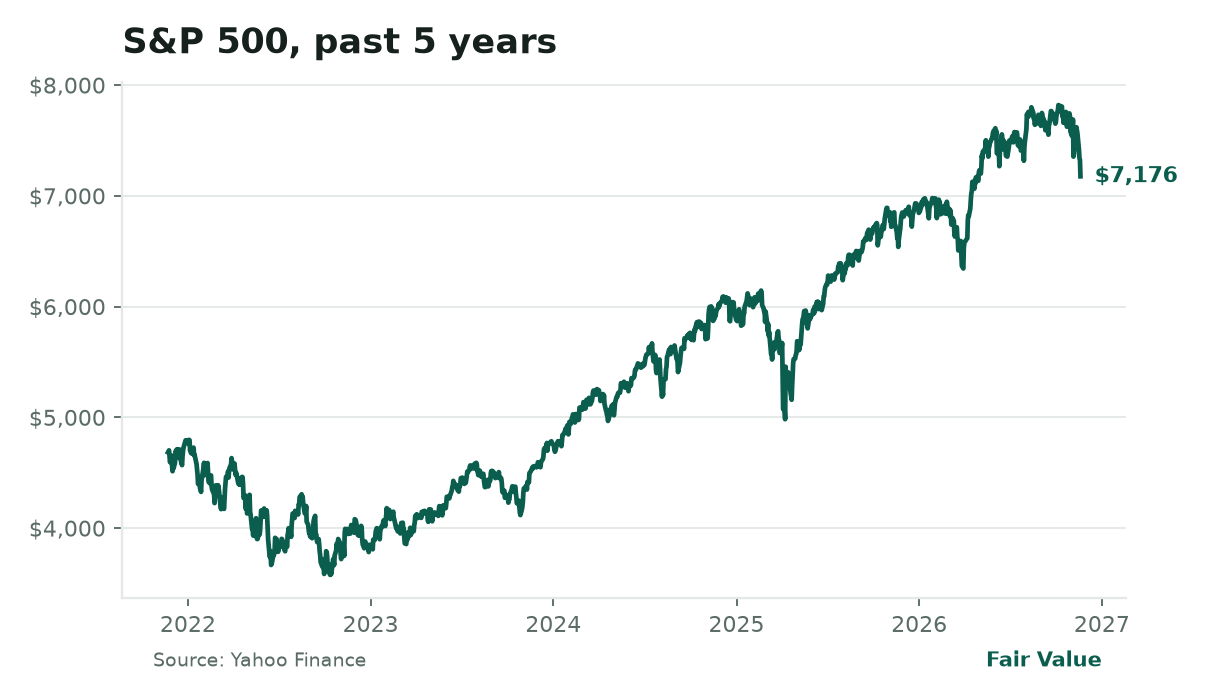 S&P 500 still near 5‑year peak. At 7,176 today, the index sits just below its highest level of 7,300 reached in early 2025; the last six‑day losing streak in April 2024 saw it fall from about 5,500 to 5,300, after which it rallied sharply. |
Over 90% of S&P 500 stocks declined. The selloff extended globally: the Nikkei fell 5.1% to 56,437, down 12.7% for the month. S&P 500 futures are down 0.6% this morning, signaling another soft open for Monday (U.S. markets closed Saturday and Sunday). The bond market delivered the day's most consequential number: the 30-year fixed mortgage rate jumped to 7.28%, up from 7.11% a week earlier, the largest weekly increase since spring. The 10-year Treasury yield closed at 5.07%, the 2-year at 4.80%, compressing the 2s10s spread to 28 basis points. High-yield spreads widened to 347 basis points; the investment-grade/high-yield spread is 254 basis points, credit markets pricing distress even as equities only recently began to crack. In commodities, the divergence deepened. Natural gas futures surged 9.8% to $3.59 per MMBtu, up 30% in three months, after weekly storage rose 20 Bcf to 3,882 Bcf, still below the five-year average. Record LNG export flows tie U.S. heating and power prices to global demand, feeding core inflation the Fed's preferred gauge misses. Meanwhile Brent crude fell 4.5% to $87.89, down 19% for the month, collapsing the Hormuz/Red Sea risk premium despite 18 confirmed tanker attacks this month. OPEC+ maintained December production targets unchanged. Gold fell 2.9% to $3,579, down 23% in three months, a rare move signaling broad liquidation of inflation hedges as real rates rise. Crypto remains in extreme fear. Bitcoin trades at $61,900 (down 26% in 30 days), Ether at $1,750 (down 29%), with the Fear & Greed index at 12. Spot Bitcoin ETFs have seen five consecutive days of outflows totaling $1.3 billion; stablecoin supply has contracted 5.9% in 30 days to $284 billion. The dollar index holds at 103.9, near a 19-month high, while USD/JPY sits at 158.9, the Fed-BOJ policy differential remains 375 basis points. | | | The big picture U.S. equities are in a confirmed downtrend. The S&P 500 has fallen 5.5% this week and 7.0% for the month, now 8.2% below its October peak. The Nasdaq-100 is down 10.1% for the month and 15.1% from its high. The Russell 2000 has dropped 11.3% in three months. Breadth is deteriorating: new 52-week highs are concentrated in defensive names while more than 20% below their highs sit NVDA (-39%), AMD (-37%), INTC (-60%), MRVL (-56%), and the entire semiconductor complex. The VIX at 29.6 reflects genuine fear, it has risen 70% in a month. The bond market sends a clearer warning than stocks. The 2s10s spread at 28 basis points is the flattest since the 2019 inversion that preceded the COVID downturn. The 10-year minus 3-month spread at 70 basis points reflects a bear flattening where short rates rise faster than long rates, historically associated with Fed tightening cycles that end in recession. High-yield spreads at 347 basis points and the HY-IG spread at 254 basis points indicate credit markets pricing a growth slowdown. The 30-year mortgage at 7.28% is the highest since 2001; new-home sales at 676,000 units are already below the typical 700-750,000 range. The dollar's strength is the transmission mechanism. At 103.9 on the ICE index and 122.7 on the broad trade-weighted measure (breaching the 122 threshold that historically signals emerging-market funding stress), a strong dollar crushes commodity prices in local currency, compresses multinational earnings (roughly 40% of S&P 500 revenue is foreign), and raises debt-service costs for dollar borrowers globally. Oil's collapse despite dual chokepoint disruption is the supply story of the year. Brent at $87.89 is down from $117+ in late October, a 25% drop, while Iran mines tankers in the Strait of Hormuz and Houthis strike Riyadh's financial district. Saudi Arabia's East-West Pipeline moves up to 5 million bpd around Hormuz entirely. OPEC+ output is back to pre-war levels at 41.2 million bpd. The IEA and Goldman Sachs both highlight a global supply surplus through 2027. Energy stocks are pricing $75 oil, not $90. Natural gas tells the opposite story. At $3.59/MMBtu, up 30% in three months, it has passed its six-month high. LNG export demand is structural: U.S. export capacity is fully utilized, and global buyers bid cargoes away from domestic storage. This feeds directly into electricity prices and heating costs, core CPI components the Fed watches, creating an inflation vector that oil's drop doesn't offset. | | | Around the world The Middle East remains a dual-chokepoint crisis. On Thursday, a Houthi missile struck the 80-story Public Investment Fund Tower in Riyadh's King Abdullah Financial District, the second attack on the district in two weeks. The PIF Tower houses Saudi Arabia's sovereign wealth fund, the engine of Vision 2030 diversification; repeated strikes appear designed to undermine foreign-investment confidence. In the Strait of Hormuz, 18 confirmed vessel attacks have occurred this month alone. Iran's navy claims three tankers struck naval mines. Shipping flows through Hormuz are estimated at 82% of pre-war levels, but war-risk insurance premiums and freight rates remain elevated. The Bab al-Mandeb strait is under effective Houthi control after Yemeni government forces withdrew November 15. Simultaneous disruption of both chokepoints, through which 25% of seaborne oil and 20% of LNG transit, creates a persistent energy-price shock risk that OPEC+ cannot offset. Japan's yen trades at 158.9 per dollar, near the 159.9 level hit November 13. The Bank of Japan held policy at 0.25% October 31 but formally declared underlying inflation at the 2% target for the first time in 14.5 years and signaled a December hike. Japan's core CPI accelerated in October as energy subsidies expired, cementing hike expectations. A Reuters poll confirms December and March hikes. The 375bp Fed-BOJ differential correlates with carry trade positioning; GDELT data shows hedge funds shifted to yen shorts over a two-week period. China's trade surplus exceeded $1 trillion in 2026 for the second consecutive year, driven by AI-related export growth. The U.S.-China trade truce holds to January 10, 2027, but does not ease restrictions on advanced AI chips. The Commerce Department's November 16 interim final rule closes the "remote access" loophole, requiring licenses for data centers worldwide providing over 12 million aggregate TPP to China-headquartered entities. California Attorney General Rob Bonta issued an investigative subpoena to Nvidia November 19, probing whether chips or confidential information reached China illegally. Evergrande liquidators have recovered only 1% of debt claims after 30 months. Europe's ECB holds the deposit rate at 2.5% and main refinancing at 2.65%, unchanged since June. Eurozone headline inflation was 3.72% year-over-year in September (core 2.57%), a three-year high driven by energy. The EU approved 113 additional sanctions listings against Russia targeting nearly 50 banks, energy companies, and oil-export entities. Estonia closes its border with Russia December 1. The euro at $1.097 is at a fresh low, with broad dollar strength outweighing Eurozone resilience. | | | Companies making news Anthropic. goes public in the largest IPO ever. The AI safety startup priced at $83 per share, raised $81.34 billion, and opened at $111.50 before closing Thursday at $97.17. The $1.4 trillion valuation implies roughly 1,167x trailing revenue (~$1.2 billion annualized as of September). Gross margins run in the mid-70s but compute costs consume nearly half of revenue. The bull case: revenue doubling every six months, enterprise net dollar retention above 130%. The bear case: every frontier model release from Google, OpenAI, or Meta instantly commoditizes the previous generation, forcing $100 million-plus retraining cycles. The IPO minted thousands of employee millionaires but failed to revive the AI trade. Nvidia. faces expanding regulatory siege. The SEC opened a civil probe November 17 into whether disclosures misled investors regarding chip sales in Asia. California AG Rob Bonta issued a subpoena November 19 investigating potential China diversions and investor deception. The Commerce Department's November 16 rule closes the remote-access loophole, requiring licenses for data centers providing significant compute to China-linked entities. New Street Research estimates 10% of projected fiscal 2027 revenue ($37-47 billion) is China-exposed. Nvidia's stock has fallen 32% in a month, wiping over $500 billion in market cap. The board formed a National Security and Export Control Oversight Committee chaired by director Suzanne Nora Johnson. AMD. drops 7.7% as semiconductor rout deepens. The stock fell to $489, down 16% for the week and 8.5% for the month. Marvell fell 4.9% to $138, down 42% in a month. Intel dropped 39% in a month. The SOXX semiconductor ETF is down 21% in three months and 37% from its June peak. The sector is experiencing "multiple compression", the SOX index trades at 17x forward earnings, 1.5 standard deviations below its five-year median of 23x. UnitedHealth. slides 5.5% to $330, extending an 18% weekly decline and 21% monthly drop after a CMS rate proposal pressured managed-care margins. Healthcare sector (XLV) fell 2.1% Thursday. Nike. falls 5.5% to $34.33, down 9% for the week and month. Shopify drops 5.3% to $132, down 24% for the month. Consumer discretionary (XLY) led sector losses at -2.8%, reflecting the mortgage-rate hit to housing-adjacent spending and the strong dollar's compression of foreign revenue. Walmart. beats modestly: EPS of $0.65 vs. $0.64 estimate (+1.6% surprise). Digital sales now drive growth while store sales fell again. The stock held relatively flat (-1.0%) in a down market, reflecting defensive positioning. PDD Holdings. surges 14.6% on EPS beat ($2.99 vs. $2.61 estimate) despite revenue miss, as cost cuts impressed investors. Alibaba missed EPS by 33% ($1.04 vs. $1.56), reflecting China consumption weakness. Intuit. sells Mailchimp for $3.68 billion to Berkshire Hathaway-backed Bending Spoons, focusing on QuickBooks, Credit Karma, and TurboTax with AI features. The deal closes a chapter on the $12 billion Mailchimp acquisition. | | | From Washington The Fed's October minutes revealed explicit concern about financial stability risks from the AI buildout. Almost all participants commented on risks if AI investment returns disappoint. Many noted rapid growth of AI-related debt through "complex and opaque financing structures," "off-balance-sheet leasing commitments," and "circular financing arrangements among AI-related firms." Fed staff judged current vulnerabilities could amplify shocks "somewhat more than usual," though strong bank and household balance sheets provide a buffer. Many participants viewed the AI buildout as a material inflation risk, citing strained supply and rising prices for technology-related consumer goods. Governor Waller doubled down Thursday: if core CPI runs near 0.3%, a 50-basis-point December hike "should be considered" and "hiking only 25 basis points would put our credibility at risk." Vice Chair Jefferson's November 19 speech emphasized data dependence but acknowledged the policy path is the primary driver for the curve, discount rates, dollar differentials, and mortgage affordability. The FOMC held the target range at 3.75-4.00% on a 10-2 vote November 18, with Governor Cook and Cleveland President Hammack dissenting for an immediate 25bp hike. The California AG subpoena to Nvidia adds a state-level securities dimension to federal export-control and SEC probes. The Commerce Department's November 16 interim final rule, effective November 19, requires licenses for exports of AI chips and servers to data centers worldwide providing over 12 million aggregate TPP to China-headquartered entities, a threshold of roughly 750 H200 GPUs or 42 Vera Rubin chips. Five additional countries face license requirements due to diversion risk. Data centers already serving restricted end-users have 90 days to cease or obtain licenses. The U.S.-China trade truce holds to January 10, 2027, but legacy-chip tariffs are delayed to June 23, 2027, seen as preserving the truce rather than easing pressure. China suspended an additional 24% levy on U.S. imports (10% remains); the U.S. extended Section 301 exclusions on 178 Chinese product categories. | | | Under the hood The flattening yield curve and widening credit spreads are signaling economic stress despite still-elevated inflation, creating a policy dilemma for the Fed. The 10y-2y Treasury spread has compressed to 28bp while high-yield spreads have widened to 347bp, a rare divergence where the market prices growth concerns even as inflation remains above target. This intensifies as the dollar strengthens to multi-year highs (DXY 103.9), pressuring multinational earnings and commodity prices. The chain: core CPI at 2.57% YoY above the Fed's 2% target → policy path uncertain with Waller threatening 50bp hikes → bonds flattening (10y-2y at 28bp, 10y-3m at 70bp) and credit spreads widening (HY OAS 347bp, HY-IG spread 254bp) signal growth concerns → strong dollar (DXY 103.9, broad 122.7) squeezes multinational earnings and depresses commodities (Brent -4.5%) → equities price downside risk (VIX 29.6, up 53% WoW) → 30-year mortgage at 7.28% pressures housing where new-home sales already below 700-750K range. The US Treasury curve flattening with the 10y-2y at 28bp is historically associated with economic slowdowns, the last inversion in 2019-2020 preceded the COVID downturn. Meanwhile credit spreads widening dramatically indicates heightened risk aversion in corporate credit markets. This divergence suggests the market is trying to reconcile two conflicting forces: near-term inflation concerns (10y breakeven 2.16%, core CPI 2.57% YoY) and longer-term growth worries. The VIX at 29.6 reflects increased uncertainty as equity markets grapple with these cross-currents. This combination has historically been a reliable leading indicator of economic stress, creating a policy dilemma for the Fed as it tries to balance inflation concerns with growth risks. Professionals debate whether this flattening curve and widening spreads are a false signal due to technical factors like quantitative tightening, or a genuine precursor to a growth slowdown that will force the Fed to pivot despite inflation still above target. Watch the 10y-2y spread for inversion below zero and whether high-yield spreads continue widening beyond 350bp. Also monitor the dollar index for signs of peaking, which would alleviate pressure on commodities and multinational earnings. | | | Worth learning today: The yield curve, deeper You've seen the yield curve mentioned repeatedly, the 2s10s spread at 28bp, the 10y-3m at 70bp. Here's the mechanism most coverage skips. The yield curve is the line connecting Treasury yields across maturities: 3-month, 2-year, 5-year, 10-year, 30-year. In a healthy expansion, it slopes upward, you demand more yield to lock money up for ten years than for three months, because you're taking more inflation and opportunity-cost risk. The spread between the 10-year and 3-month (or 2-year) is the market's bet on the cycle. When the curve flattens, short rates rise faster than long rates. That happens when the Fed hikes (lifting the front end) but the bond market doesn't believe the hikes will last, so long yields stay anchored or rise less. The 10y-2y at 28bp means investors get almost no extra yield for extending duration from two years to ten. They're saying: "We expect the Fed to cut soon, so why lock up money at 5.07% for ten years when we can roll 2-year paper at 4.80% and capture the cuts?" When the curve inverts (2-year yields more than 10-year), the market is pricing a recession. Every inversion since 1955 has preceded a downturn, with a 6-24 month lag. The 10y-3m spread is the Fed's preferred recession indicator, it inverted in 2019, 2006, 2000, 1989, 1978. Today it's positive at 70bp, but that's because the 3-month bill yields ~4.37% while the 10-year yields 5.07%. The steepening from negative to positive this year wasn't optimism, it was the front end falling faster than the back end as rate-cut expectations got pushed out. The sharper edge: the curve can lie. In 1998, the 2s10s inverted briefly but the Fed cut rates and the expansion continued. In 2022-2023, the curve inverted deeply and a recession didn't arrive on schedule, fiscal stimulus, AI capex, and immigration-driven labor supply extended the cycle. But the signal's track record is too strong to ignore. When the 10y-3m inverts and stays inverted for a full quarter, the probability of a recession within 12 months exceeds 70% per New York Fed research. Quick check: why would a hot CPI print push mortgage rates up? Because mortgages are priced off the 10-year Treasury, and hot inflation → Fed hikes → higher 10-year yield → higher mortgage rates. The 12-18 month lag means today's mortgage rate reflects the Fed's 2025 tightening, not today's CPI. |
| | | What to watch this week | ▸ | Monday, November 23 — HPE earnings after hours (EPS est. $1.17), enterprise hardware demand check. | | ▸ | Tuesday, November 24 — Bilibili earnings (EPS est. $0.27), Chinese consumer sentiment. | | ▸ | Wednesday, November 25 — Zoom earnings (EPS est. $1.49), enterprise software spending. | | ▸ | Thursday, November 26 — U.S. markets closed for Thanksgiving. | | ▸ | Friday, November 27 — U.S. equity markets close early (1:00 PM ET); light liquidity. |
No high-impact central-bank decisions or major data releases (CPI, jobs, GDP) are scheduled this week. The Fed enters its blackout period ahead of the December 9-10 FOMC meeting. Watch for Fed speak, any governor commenting on the 50bp vs 25bp debate moves markets. The BOJ's December 18-19 meeting is the next major central-bank event; a hike is fully priced in. |
| |
Not financial advice. This brief is for informational and educational purposes only and does not constitute investment advice or a recommendation to buy or sell any security. Data: macro indicators per FRED® (Federal Reserve Bank of St. Louis); not endorsed or certified by the Federal Reserve Bank of St. Louis. Energy data per the U.S. Energy Information Administration (EIA). Auction data per U.S. Treasury Fiscal Data. Filings per SEC EDGAR. Market prices per Yahoo Finance. Earnings calendar per Financial Modeling Prep. Crypto data per Binance and CoinGecko. WSJ headlines per WSJ RSS feeds. |
|
