

Eye colour and portfolio types - view on the website
In any introductory statistics course, you'll learn that the four types of data are nominal, ordinal, interval, and ratio. You'll be assessed on this with a multiple-choice question: What data type is Celsius? Then promptly forget this information, probably for the rest of your life.
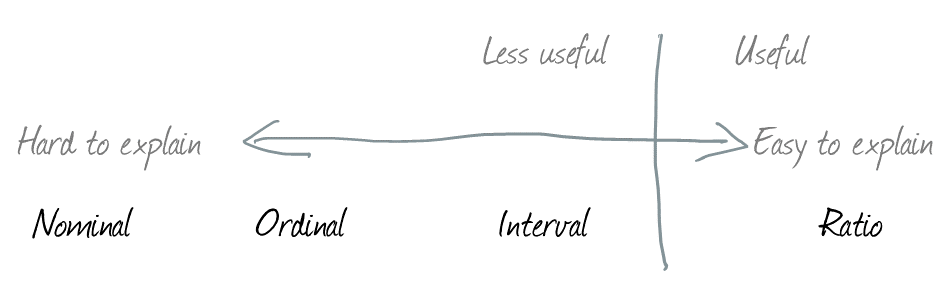
Unlike most aspects of statistics, the names are instructional. Nominal means no order. Ordinal means there is order, but the gaps have no meaning. Interval means there is order and the gaps are equal. Ratio means there is order, the gaps have meaning and zero means what you'd expect (nothing).
Whilst this is in theory useful, few, if any people will ever use analysis techniques for data other than ratio. I wish the notes I taught to had the following diagram.
If you're keen to read up in more detail Statology, Statistics by Jim and GraphPad have more examples on this topic.
An easier version of this is that if the data is in an SI unit (which money is the 8th SI unit), you're using ratio, and you don't need to consider the limitation.
If I asked you if you would analyse eye colour and portfolio types the same way, you'd recoil in concern and question why I have "Dr" in front of my name. They're both nominal data types. Any projection you put on portfolio types you should apply to eye colour.
It's worth considering that any order forced upon a nominal data type is subjective and likely to influence how you think about the data.
Once you see this, you'll always see this.
Andrew
---
Want more? Great.
On LinkedIn I describe why this concept is hard to implement.
Here's a short data bite if you want to hear me expand on the idea.
You just read issue #2 of Dr Andrew Pratley. You can also browse the full archives of this newsletter.