#81 - Visualizing data in physical artworks
Hello! 👋
As I was researching artworks this week, a common theme emerged so this edition is focused on data visualizations using different media.
Enjoy! 💚
Charlie
Projects
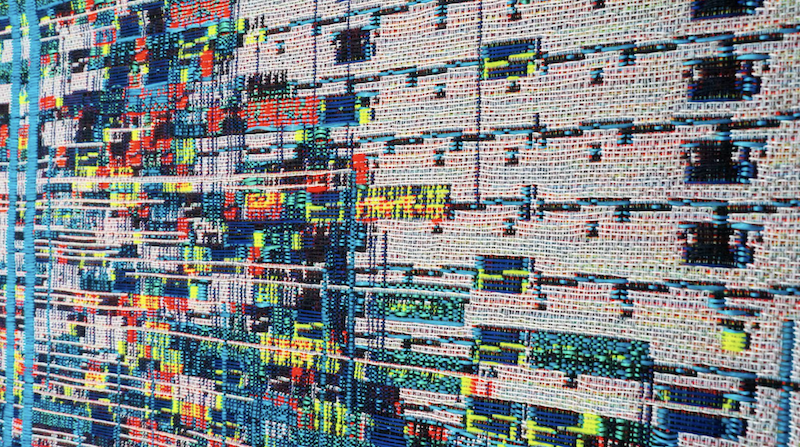
Hyperthread
This project by Richard Vijgen explores the representation of parametric chip design on Jacquard Loom. Instead of projecting chip patterns on a silicon wafer at nanometer scale, they are translated into weaving instructions at millimeter scale, resulting in a series of tapestries that reveal different chips at human scale. You can read more about it on the artist’s website.
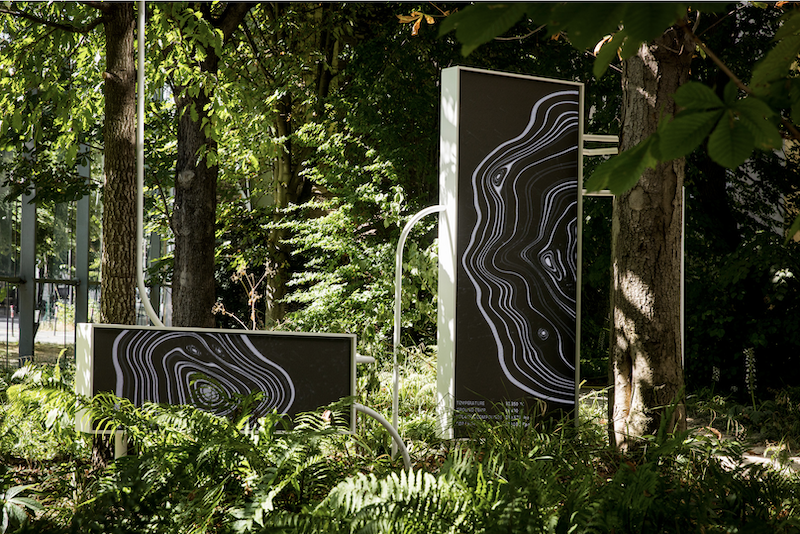
Symbiosa
This artwork by y=f(x) is a real-time data visualization providing a visual narrative on the impact that climate change has on the nature in Paris. Using 12 sensors, the system captures variations in the air quality, tree’s photosynthesis, chemical air compounds and more to create visuals that resemble the patterns of tree rings.
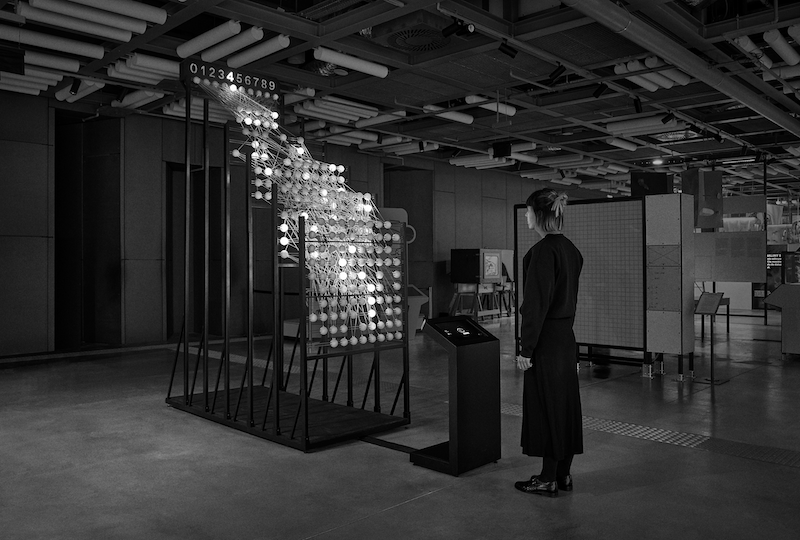
The Abacus
Interactive light sculpture by PanGenerator representing a real, functioning deep neural network. Trained to do simple hand written digit classification, this installation is made of 195 custom 3D printed neurons. As people draw a digit on the touch screen, the neurons light up in each layer to represent the behavior of the network during the inference.
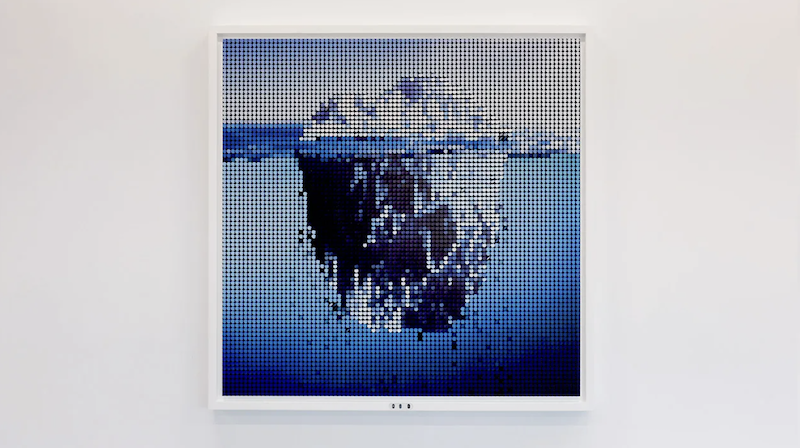
Antarctic Ice
Interactive kinetic installation by Breakfast Studio showing the current state of the melting ice sheets in Antarctica, driven by data from NASA.