Drinking sea water
I'm co-authoring a research paper analyzing underinvestment in Philadelphia's school buildings between 2005-2021 with Camika Royal. We're presenting it in a couple weeks at the American Educational Research Association's online meeting, and I wanted to see what you all think of something I'm finding in the numbers before we present.
Along with so many people in this city, I've wanted to know why Philly's buildings are so toxic. Readers won't be surprised to hear that I've wondered whether the municipal bond market has something to do with it. Bonds, bought and sold on Wall Street, are how school districts like Philadelphia finance their facilities. So for our paper (I focused on the numbers aspect), I collected data on the district's borrowing and capital expenditure during the years that the information is publicly available: 2005-2021. I wanted to see how efficient the bond market is at allocating revenues for capital outlay.
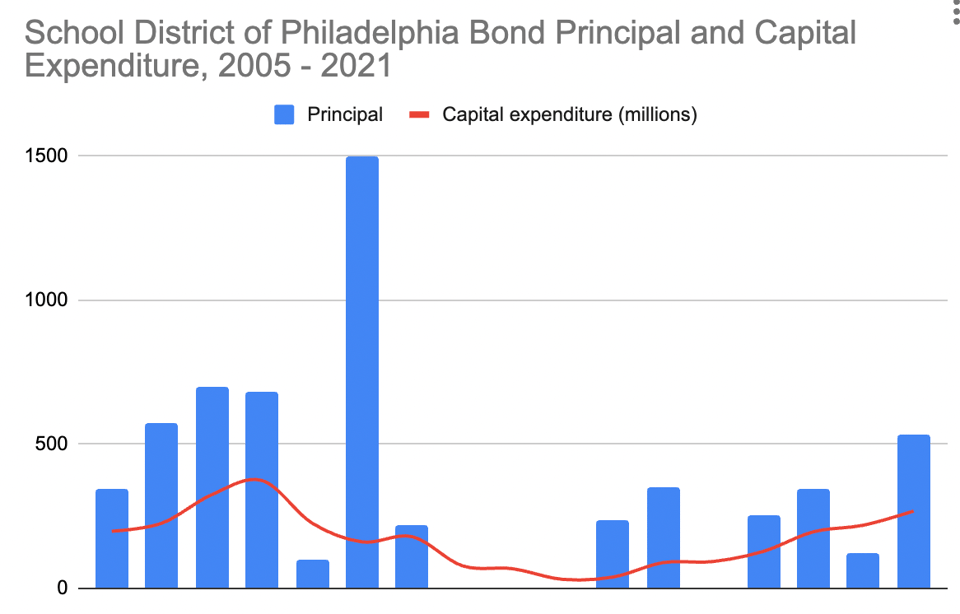
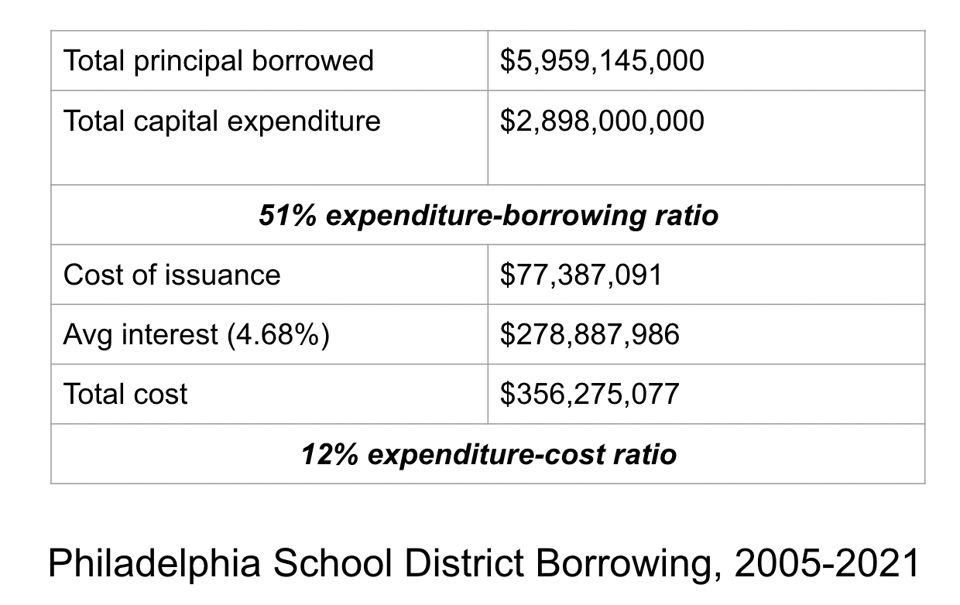
During this period, the municipal bond market lent the district roughly $6 billion in bonds. The district spent $2.9 billion in capital expenditures on their facilities.
That's a two-to-one ratio.
Here's a chart that presents this dynamic, with the blue bars showing the total bond principal lent by year and the red line showing capital expenditure during that same period. I call it a "snake in the grass" graph because the capital expenditure crawls along among the taller blades of bond principal.

There's a lot going on in this chart historically, which Camika and I write about in the paper. I just want to focus on the numbers right now, which was what I focused on in the project.
Not only was there a 2:1 ratio of dollars lent to dollars spent, but we have to take into account soft costs like interest and fees. The average interest rate of these bonds was a relatively high 4.68% given the low interest rate environment during that time, particularly after the great financial crisis. This means that the district has been on the hook for about $279 million in interest payments on the bonds.
The cost of selling those bonds totaled $77.4 million in fees, discounts, and other expenses related to completing the deals with underwriters, counsel, and investors.
So what does this all mean?
Overall, for every two dollars the municipal market lent the school district, the district could only spend one dollar on its buildings during this period.
When taking into consideration the amount of money per dollar that it cost to get and use this money from the municipal bond market, namely interest and fees--which came to 12 cents for every dollar--what I'm finding is that lending two dollars only yielded 88 cents of actual capital expenditure in Philadelphia during this period.

This seems extremely inefficient. Ideally, we'd want every penny of money going towards school facilities to be actually spent on those facilities. But this is far from the case in Philadelphia.
Now you might say: it's the district's fault. They're not spending it well, they're probably corrupt and wasteful. But when we look at national trends we find the same inefficiency.
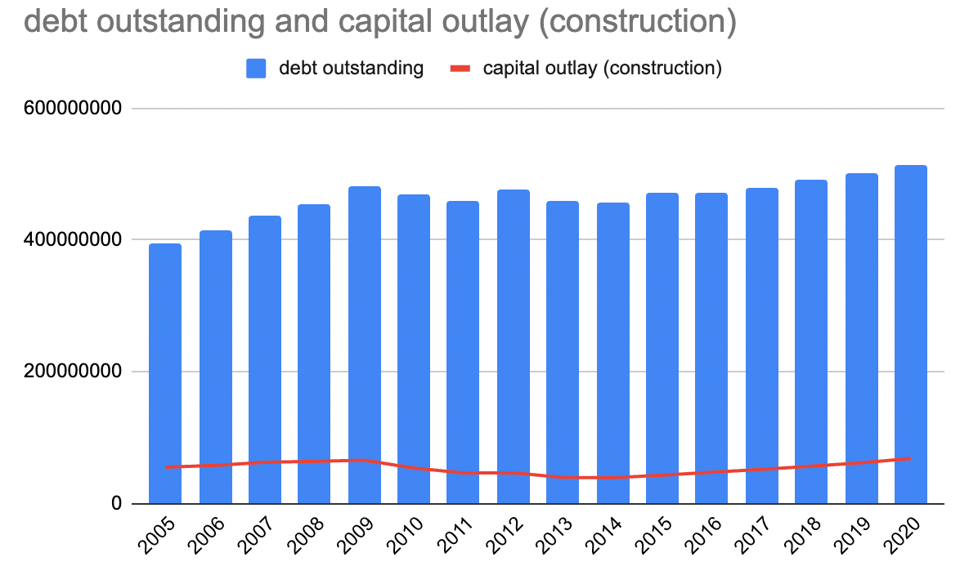
I can't get numbers on total bond principal, interest rates, and fees nationally. Nobody tracks that (at least for prices I can afford). But the federal government does keep track of the debt that school districts owe, as well as their capital expenditures for things like construction.
When I found those numbers, the graph looked a lot like the one I presented above: a snake in the grass, maybe even in taller grass.
Here we have school district debt outstanding (blue) against capital outlay for construction (red) between 2005-2020:

I haven't done any other district-specific studies, nor have I looked at longer periods of time, but for this period in Philly when these numbers are available, this is the pattern I'm finding, which shows up nationally too.
I think the numbers are bad for the municipal bond market. Given the national trend, I think we can reasonably adopt a structural hypothesis here and seriously ask whether private credit markets are the structural cause of underinvestment in school facilities in Philadelphia and elsewhere.
The analogy I've been thinking of using is drinking sea water. When school districts like Philadelphia are thirsty for money for their facilities, they find themselves surrounded by a salty ocean of private credit. Given that there's no other water around they drink, but the water makes them less healthy rather than helping them to survive.