Aggressively regressive
Quick links
School board member training by Public School Strong, happening 12/4.
An expansive review of my book in Jacobin published last week by Max Sawicky.
I’ll be at Seton Hall University doing a book signing at 2pm on 12/3, and then also on 12/3 at HUUB in Orange, NJ at 7pm with NJEA educators and organizers.
On 12/4, I’ll be addressing The Neighborhood School’s (CEC1) PTA Advocacy Committee at 8:30am after dropoff in Lower Manhattan.
Justin Brannan is the Finance Chair of the New York City Council. He’s a great follow on twitter, even if the platform is nearly unusable. A few months ago he tweeted this:
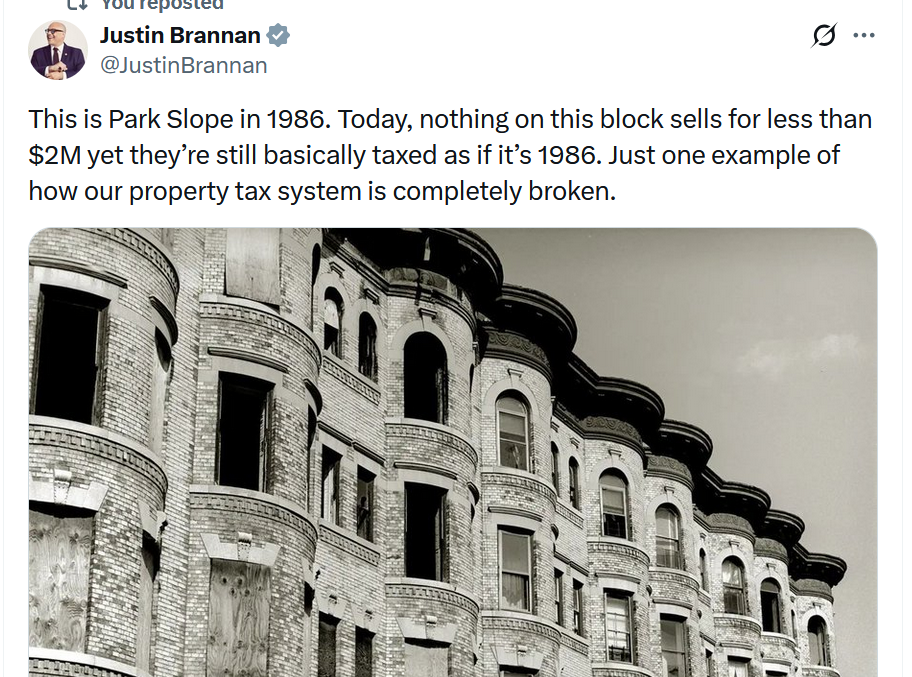
My question over the last few weeks has been: how exactly is NYC’s property tax system broken?
A handful of developed analyses I’ve found echo Brannan’s, like from Tax Equity Now, Community Service Society, and the Comptroller himself.
What’s the current system that Brannan says is outdated? There are tax classes: class 1 = small homes, class 2 = large residential buildings, class 3 = utility and special franchise properties, class 4 = offices and factories. The problem is disparities in how property gets assessed within these classes and disparities between them.
The key measure for expressing this brokenness is “effective tax rate,” which is how much you pay in taxes relative to how much income you earn.
Tax Equity Now (TENNY) writes:
Within each tax class there are inequities – homes with the same sales-price or market value pay very different tax amounts.
There are inequities between owners in different tax classes; a small home in Brooklyn may pay more in taxes than a very high-priced cooperative apartment in Manhattan.
For one thing, these differences leave money on the table and make the property tax, as one of the reports calls it, “aggressively regressive.” Andrew Perry writing at Phenomenal World points out that assessments have been at 20% of full market value for ten years, which means that “[w]hile the entirety of New York City’s taxable real estate is worth some $1.58 trillion today, just $309 billion of this is liable for paying city property taxes.”
While their numbers are from 2017, this TENNY graph charting the effective tax rate (green line) vs. assessed value of the property (blue bar) is wild:
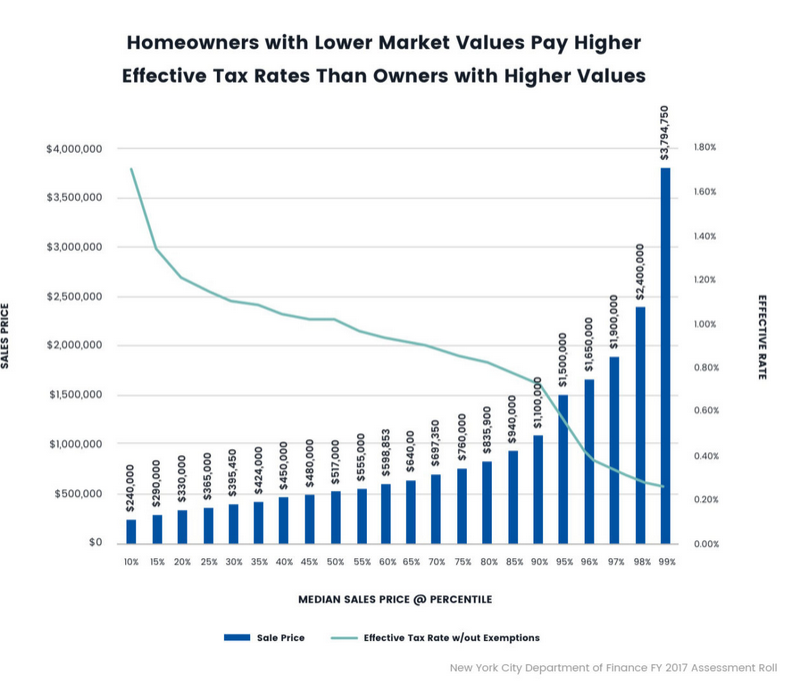
Renters bare a disproportionate share of the tax burden as well, as we’ll see below. And then there’s racial disparity, which means property owners of color are paying more.
The system itself is turning 50 this year, and dates back to 1975 when a state supreme court case out of Islip, NY was handed down (my dad is from Islip!). The CCS report has a helpful timeline.
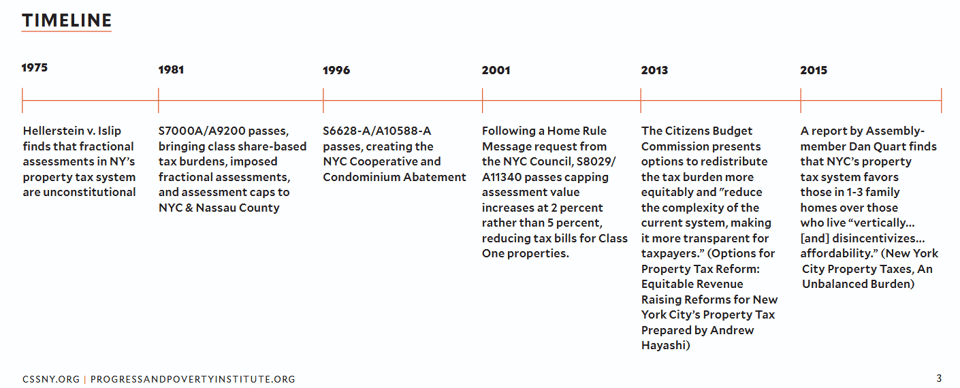
The history shows that it’s fractional assessment and assessment caps, combined with the classification of properties and their siloing/favoring, that have caused all the issues. CCS have up to date numbers worth laying out in full:
Large Multifamily and Commercial Properties Are
Over-Taxed: Low-density residential properties com-
prising 1-3 units (Class 1) pay an effective tax
rate (ETR) of only 0.7%, significantly lower than for
all other classes of property. By comparison, apart-
ment buildings with more than 10 units (Class 2) face
an average ETR of 3.6%.
In a City of Renters, Homeowners Get the Breaks:
More than two-thirds of households in NYC are rent-
ers, yet properties which are owner-occupied tend to
pay lower taxes. We find that the average ETR paid by
homeowners is 3.0%, compared to 4.3% paid by those
who own rental properties. Single family homes—in-
cluding mansions and brownstones in neighborhoods
like Forest Hills, Queens and Prospect Park, Brook-
lyn— have an ETR that is 2.4 times less than low-den-
sity rentals and more than 5 times less than large
rentals.
The System Penalizes Poverty and Upholds Racial
Disparity: Properties worth between $500,000 and
$600,000 per unit have an average effective tax rate
that is 1.3 times higher than those worth more than $1 million, while properties worth less than $300,000 per unit face an average effective tax rate that is 3 times higher than those most valuable properties. Some of the last remaining mostly Black neighborhoods in the city— Canarsie, East New York, and Cambria Heights— are paying tax rates double those paid by Park Slope or East Village homeowners. The hot market Brooklyn neighborhoods along the East River have Class 2 ETRs 2.3 percentage points higher on average than the largest Hispanic (non-Black) communities like Hunts Point and North Corona.
So people in East New York are effectively paying double property taxes than people in Park Slope. Thus the aggressively regressive description of the system. I feel like there’s a rabbit hole in each class of properties, along with examining each of the methods property is assessed, and then proposals for how to change the system. For the latter, there was a 2021 report that lays what has to happen and a lot of it requires state action.
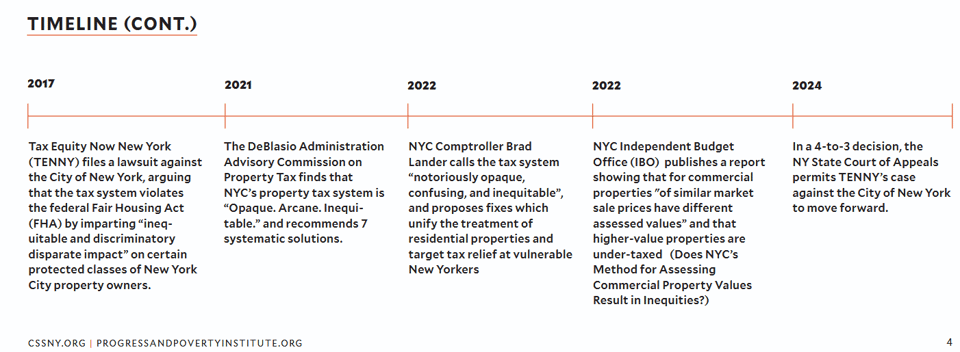
Meanwhile, a court case filed by TENNY that the system violates federal housing law was finally permitted in a 4-3 decision, so that’ll be ongoing: maybe the courts will force the legislature into action.
As an aside, when it comes to Mamdani’s affordability agenda, I wonder what affordability implies—as a concept—for those that can pay more. For the people in the small Park Slope brownstones paying half what the Canarsie Black working class homeowners pay—an affordability agenda means that they should pay more and the latter less, right?
I’ll get to this stuff later. For now, let’s go back to how this impacts schools.
The reason why this question matters for understanding NYC school finance—my new quest—is that 56% of NYC schools’ revenue comes from local sources, of which property tax is the core stream. If the rich could pay more in the scenario above, they’d be paying for schools.
To get at this connection, let’s look at the Comptroller’s audit report for fiscal year 2025. There are some interesting numbers to reflect on.
Local rev
The city generates $87.526 billion locally, and 75.5% of its spending comes from this revenue. $81.3 billion of that is technically city-generated. Here’s the breakdown of the majority of those revenues:
Property tax = $35.266 billion (43.4%)
Personal income tax and pass through entity tax = $17.9 billion (22.1%)
Note the pass through entity tax above, which is an interesting beast, just so we’re clear:
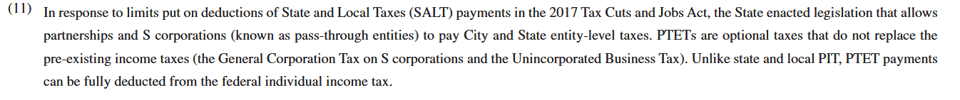
It’s a creature of the first Trump administration’s use of the tax code to punish blue states like New York where wealthy people could write off a bunch of state and local taxes on their federal taxes. The 2017 tax bill capped that write off pretty low, screwing them, but New York State passed a bill that let them circumvent that move.
Lander’s office notes that revenues are actually up viz. property taxes, and that’s because the price of housing is increasing. That’s good news for homeowners (sort of) and bad news for renters.
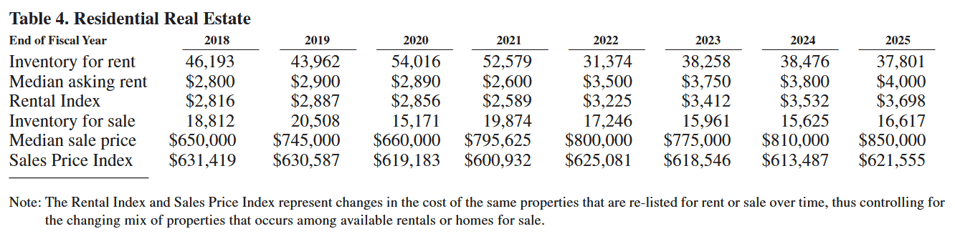
You can see here that rent is increasing, stock is decreasing, and sale prices are increasing—which means taxes collected go up.
And while that makes the city less affordable for everyone, it also brings in revenue for schools.
Seems like fixing the property tax system (at least disparities within Class 1, mentioned above) would bring in more revenue while delivering affordability to core constituencies for Mamdani.
Important note: this could be a tax the rich scheme but without the state’s involvement, because the city can control its property tax without going to the state legislature.
Forfeit
Another big thing we should talk about is tax expenditure, or when the city government chooses not to tax something and forfeits revenue. Abatements, exemptions, and other sorts of financing inhabit this land.
According to Lander’s office, the city left about $8 billion on the table, five of which was city-based. The biggest tax expenditure in the local category was a program called 421-a that gave tax incentives for multi-family housing construction. And while this program ended in 2022, another one, called 485-x has just come into being last year and we haven’t seen those abatements. Wonder how much there’ll be!
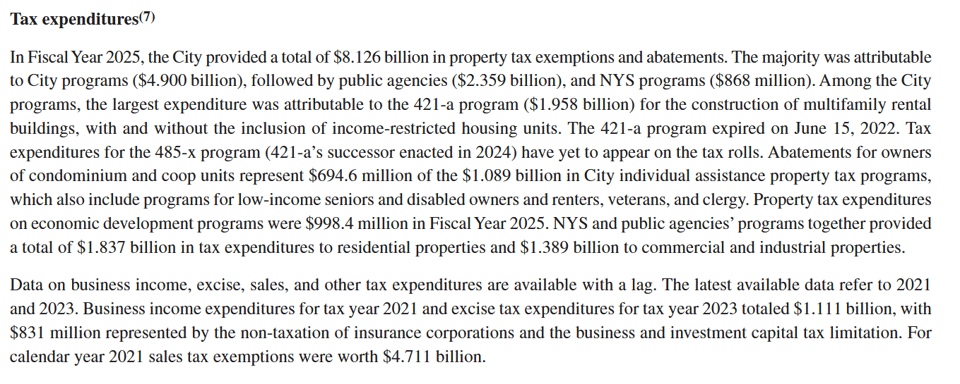
I’m noting here that there was $1.389 billion in tax expenditures for commercial and industrial purposes. I’d like to dig into that number to see who’s not getting taxed.
Debt wish
All the while, I want to juxtapose these numbers with Lander’s all-encompassing pie chart on the city’s debt obligations:
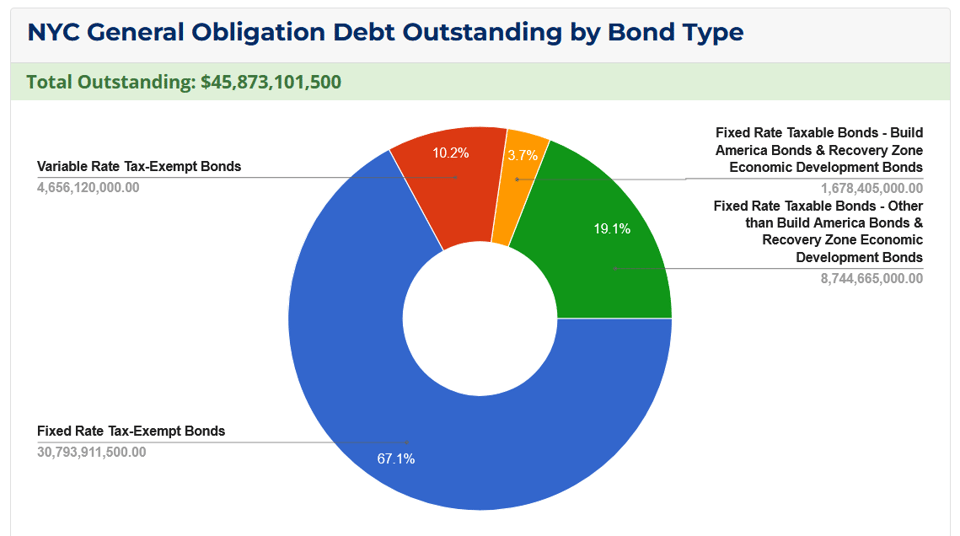
That’s right, the city has $45.8 billion in total outstanding debt service, about 10% of which is in variable rate instruments. So a lot of the money I just talked about will probably go to servicing this debt, which is what ultimately finances schools. The tax revenues just repay that debt.
Affordability loops
What I’m taking from this so far is that there’s an established local position on the aggressive regressivity of the local property taxation system where lower income people pay more in taxes, and the city is waiting for the state to do something about it. Meanwhile, the city is also leaving more than a billion dollars on the table for commercial and industrial purposes. Seems like a good idea to fix it.
But doing so puts Mamdani’s affordability agenda into some interesting perspective, particularly when it comes to housing and education: making the city more affordable for homeowners is very different than making it affordable for renters, each of which makes it very different to increase funding for schools, since taxing both forms the majority of educational revenue.