
Clouds, curves, and elevations
Adding cloudiness forecasts to BumpySkies, and a bunch of other improvements to turbulence-forecast accuracy.
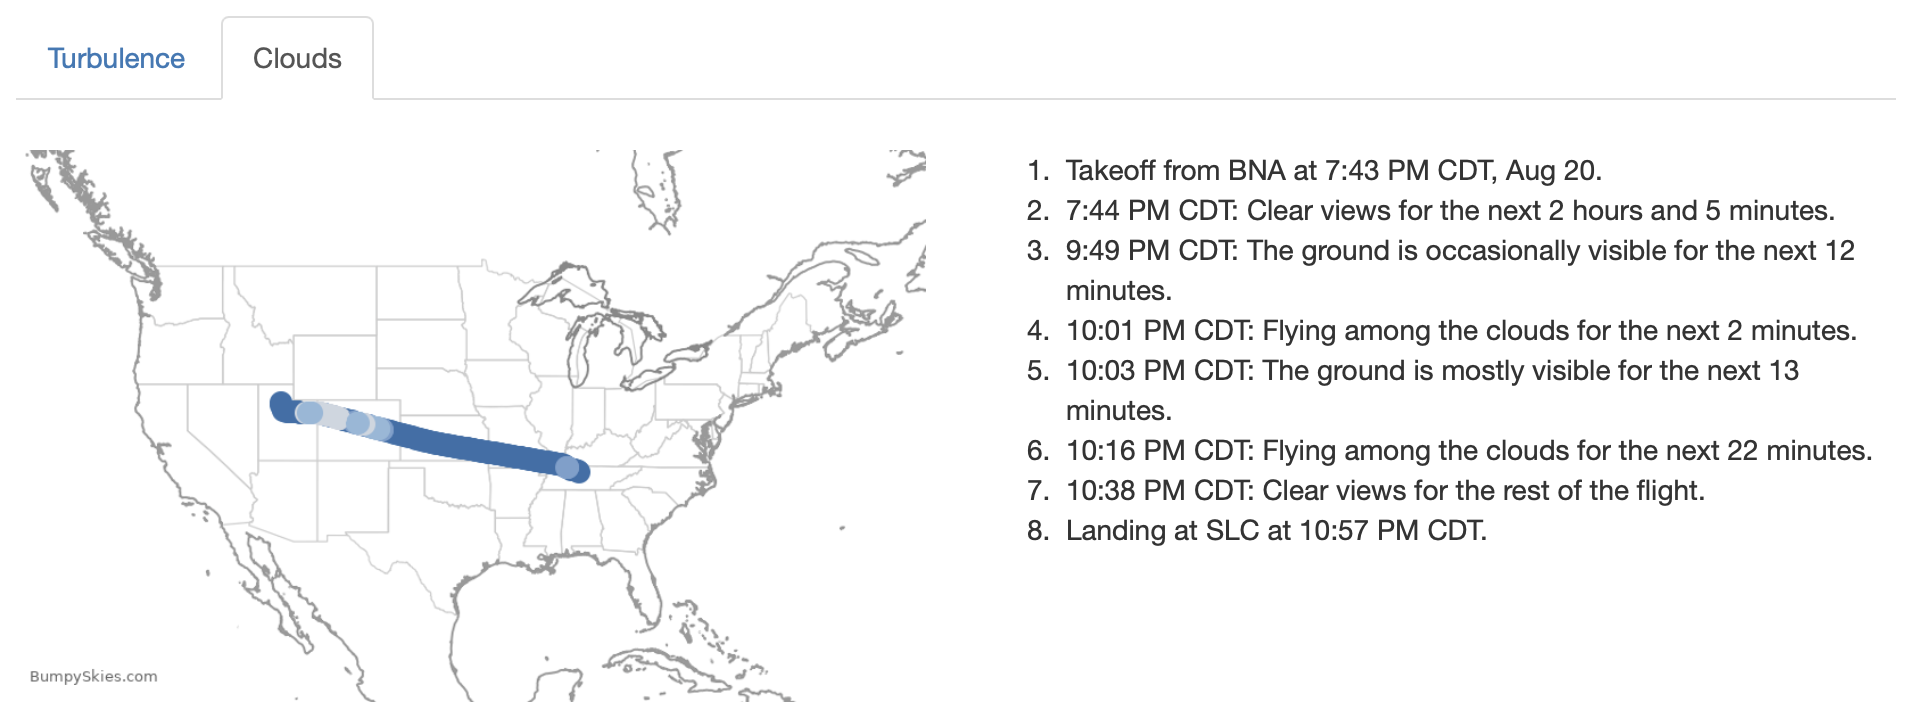
Happy late summer, fellow fliers. I've just launched a new cloud-cover forecasting feature for BumpySkies First Class, the premium tier that I rolled out last month. I've also made a few improvements to the way that BumpySkies locates airports and computes flight paths which makes all of the website's forecasts better. And then we all became briefly confused and sad in West Palm Beach.
Cloudiness forecasts
The BumpySkies forecast view has something new: tabs above the map, letting you switch from Turbulence—the default, free, familiar forecast that gives BumpySkies its name—to Clouds. Here, go look at a random forecast, you'll see what I mean. If you're a BumpySkies First Class subscriber, then that latter tab changes the color of the map's flight-route line to a deep blue, probably dotted with pale-blue or white clusters. It looks something like the image at the top of this newsletter.
This new view is a forecast of the cloud cover that this flight is likely to encounter, and in particular the cloud cover that exists between the flight's planned altitude and the ground. Stretches of deep blue mean clear views, while lighter blues indicate progressively thicker cloud layers obscuring any sight of the ground; a nearly white spot marks an interval flying directly through clouds, with no ground visibility at all. The text summary that appears next to the map spells out the cloud-encounter forecast as a list of time-stamped events, just as the BumpySkies turbulence forecast has always done.
This feature comes from a very personal motivation. As a nervous flier, I always choose a window seat whenever I can. Seeing the ground below, steady and scrolling serenely by, helps to calm and reassure me no matter what sounds I hear or bodily sensations I experience as a hyper-attuned passenger. While I vastly prefer clear views of the ground, seeing cloud-tops drifting by below is also all right—but I do dislike the disorienting gray-out that accompanies travel directly through a cloud layer.
Much as with turbulence, I'm well aware that encountering clouds is a very common flight phenomenon, and often a necessary one: so long as the weather they bring isn't too nasty, a flight plan won't wait for the clouds to literally part over its origin or destination airports before taking off or landing. Also like turbulence, clouds pose no risk to the flight—but I still wish I knew ahead of time how often I'd encounter them on any given trip, just to alleviate unpleasant surprises or disappointment. Conversely, it would be nice to know how often I could expect to enjoy unobstructed views of the earth below.
And so, when I learned some time ago that NOAA's publicly available weather data includes a continuously updated set of cloud layer location-and-altitude forecasts, I knew that I wanted to fit it into BumpySkies. And now I have! The data covers the whole planet, so this new feature works with both domestic flights and international ones. BumpySkies applies the data just like it has long done with turbulence numbers: If you're flying from Newark to Los Angeles at noon, then BumpySkies uses lunchtime numbers to color the east end of the route, and applies dinnertime-stamped data for the western end. (Time-zone differences to one side, of course.)
While I designed this feature with my own nervous-flier peculiarities in mind, I'm willing to wager I'm not the only person this can help. I really look forward to trying it out for myself on my upcoming flights next month—and if you're a First Class supporter of BumpySkies, then I'd love to hear your thoughts on it too.
The first weeks of First Class
In the statistically likely case that you're not a BumpySkies First Class subscriber, clicking the Clouds tab displays an invitation to become one. I'm proud to say that a $5-per-month subscription now gets you two premium features, between these new cloudiness forecasts and the notification system that I launched alongside First Class in July. BumpySkies is a passion project that I work on—and pay for—independently, and I do rely on subscriptions to keep it financially viable. If you find value in BumpySkies—and if you can afford to do so—I would humbly ask that you consider becoming a First Class subscriber. It costs about as much as a small airport coffee, and every subscription helps BumpySkies make life a little calmer for tens of thousands of our fellow nervous fliers every month. (No kidding: the website has about 20,000 monthly active users right now, up from the 8,000 that visited every month when I resumed work on the project last October.)
First Class has been online for a bit over a month now, and I send my gratitude out to all who've signed up just on the basis of the notifications feature—both for their support, and for their early bug reports! I almost immediately found that notifications tripped over code-shared flights (such as a Republic Airways flight sold under Delta Air Lines branding), so I fixed that early on. More recently, one subscriber missed a forecast notification for a flight departing Palm Beach International Airport, because that airport abruptly changed its codes from KPBI/PBI to KDJT/DJT, a switchover which completed only this past week. That threw things off a bit for BumpySkies, which is on me: I did hear the news about the upcoming change, and I should have updated my website's database of airport codes prior to immediately willing myself to forget the latest instance of an eye-wateringly venal and stupid trend. It's fixed now, and another lesson is learned about operating a website for the public good in a political environment whose leadership couldn't care less about that.
This is a free newsletter, by the way
You've read half of this issue of BumpySkies News! Perhaps you'd like to subscribe for free?
Better elevations, softer curves
The other thing I did with BumpySkies in July happened while stuck at O'Hare for thirteen hours, waiting for some especially gnarly weather to stop hovering over New York. (Yet another welcome reminder that airlines really do value customer safety over customer convenience, a trade-off I'll always accept, however backhanded it sometimes feels.) The Starbucks near ORD gate C27 was blessedly open late, so I sat with my $5 Americano (which is the same price as—wait, I already made that pitch, didn't I, never mind) and hammered out some improvements to how BumpySkies estimates an airplane's altitude at either end of a flight.
Until recently, BumpySkies treated all airports everywhere in the world as lying at sea level. Passing the time in Concourse C, I found a nice cache of public airport data that includes the true elevation of each one, and I added all of these numbers to the website's forecast-figuring. And so, BumpySkies no longer traces identical ascent-curves to cruise level, regardless of whether the origin is low-lying Boston or mile-high Denver.
And regarding those curves, I discovered that BumpySkies treated the vertical polygon traced by an ascending or descending plane quite naively, treating it as a sharp-angled trapezoid rather than having a smooth, round shape on either end. Flights typically start with a rapid climb and a gradual leveling-off at the planned cruise altitude, and then an equally smooth curve earthwards towards its destination runway. These are still estimates, of course; in reality a flight's just as likely to stair-step through a few discrete elevation changes, for one reason or another. Still, I expect that these curvier estimates reflect reality more often than the harshly straight lines that BumpySkies used before, and that should make for more accurate turbulence and cloudiness forecasts.
Rebalanced turbulence-intensity reports
After making it back to New York—and catching up on lost sleep—the above work inspired me to revisit other assumptions that BumpySkies has been making since its debut ten years ago. This included the rubric that it uses to decide what language and colors that it should use to describe any particular patch of turbulence along a flight route. BumpySkies classifies its underlying numerical turbulence data as very light, light, moderate, and (rarely) severe. In 2016, I mapped these levels to number-ranges using a rubric that is lost to time. I have now updated them to match the ranges that NOAA uses in its own turbulence-guidance products, in reference to the medium-sized aircraft class that makes up the vast majority of passenger traffic.
The upshot for BumpySkies users is that reported turbulence looks slightly more intense now, across all flights, with moderate and severe turbulence labels showing up a bit more often. Beyond being a little more accurate than before, this behavior is one of a few places in the project where, given the choice between reporting two values, BumpySkies chooses the less-comfortable one. While this arguably results in some mild overcorrection, I'm very okay with that: I would rather forecast a bumpier flight and let the passenger be pleasantly surprised when it turns out not so bad, than have the opposite happen.
And that wraps the BumpySkies news for August. I've got a short flight to Maine and a rather longer one to Scotland coming up this fall, and look forward to using my funky little website to help me get through them. I'm grateful that so many others find BumpySkies valuable, too, and I always appreciate hearing from fellow fliers about it; you can reach me any time at jmac@bumpyskies.com, or just reply to this newsletter. As always, I wish you nothing but swift and smooth travels ahead.
--jmac