New: visualising Bitcoin’s price, scale, & odds
Kicking off the new year with my Bitcoin Rainbow Chart and some new Bitcoin calculators.
Happy new year!
A quick note to share something new I’ve been working on.
If you’ve been following along for a while, you’ll know most of what I publish is educational - explainers, deep dives, and attempts to make Bitcoin’s mechanics more legible. One thing I’ve found over time is that some aspects of Bitcoin are hard to feel until you can see or interact with the numbers directly.
That’s what’s led me to start building more interactive visualisations and calculators alongside the articles.
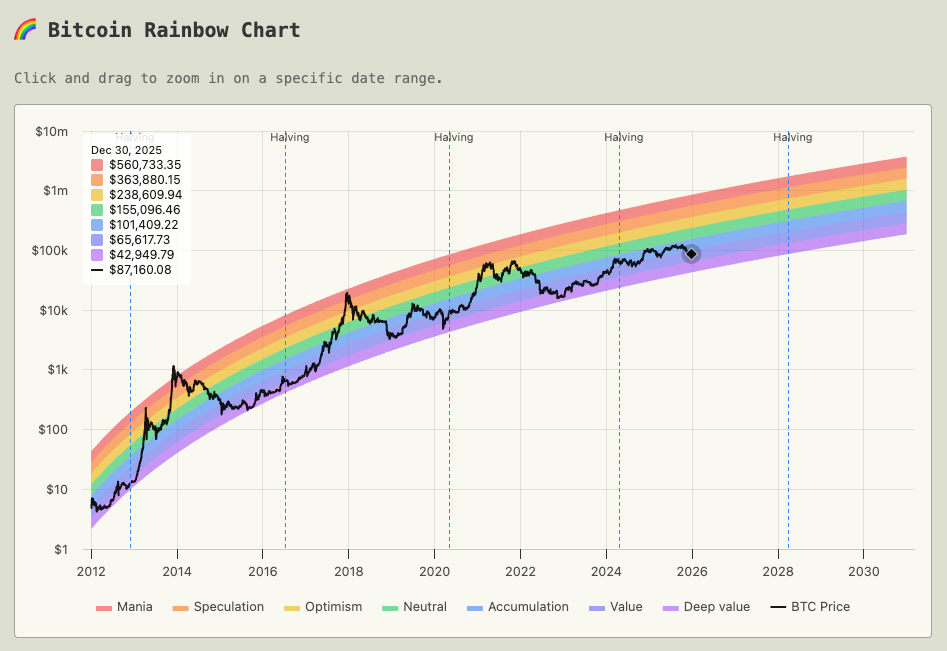
The latest is my Bitcoin Rainbow Chart, which takes Bitcoin’s full price history and places it into long-term context. It’s not a prediction tool, and it’s not about timing tops or bottoms - it’s simply a way to see where today’s price sits relative to Bitcoin’s historical trajectory.
Alongside that, I’ve also built:
a Solo Mining calculator, which helps make the odds and timescales involved in mining a block tangible
a “What if I’d bought Bitcoin?” calculator, which effectively backtests Bitcoin purchases using daily close prices since 2010
All of these are built with the same goal as the articles: to make abstract numbers more concrete, and to help intuition catch up with reality. All my calculators and charts live under the Resources section on my website.
As always, feedback is welcome - especially if there are other Bitcoin concepts you think would benefit from being visualised rather than explained in words.
Best,
Bennet