Formatting with SpectreConsole
In this issue:
I've written about the PwshSpectreConsole module before and I hope you've installed the module and played around with it. The module makes it easy to use the SpectreConsole library in PowerShell. The module commands aren't designed to augment PowerShell as a management tool. Rather, the module is designed to enhance the user experience when working with PowerShell in the console. I realize I often focus on PowerShell as a management engine, or managing things at scale. But sometimes, we simply need to consume information generated by PowerShell. Commands in the PwshSpectreConsole module bring features that focus on the user experience in PowerShell. Today, I want to focus on the formatting features available in the PwshSpectreConsole module.
The module has many formatting commands.
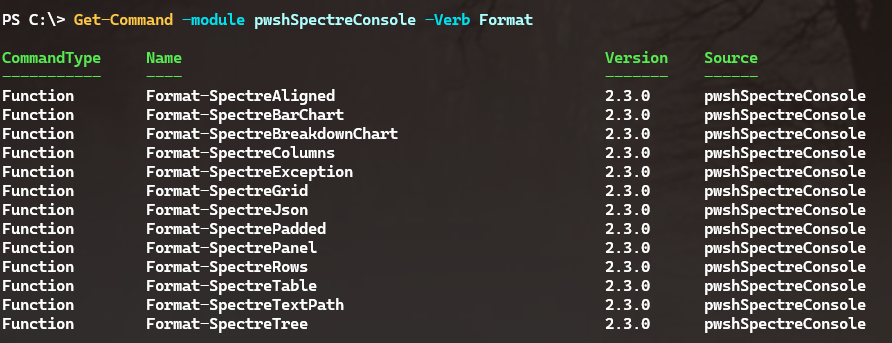
I'm not going to cover every command in detail and I am assuming you will read full help and examples.
One thing to keep in mind, is that many of these features will require scripting to fully realize. Only a few commands are easy to use directly in a PowerShell pipelined expression. Be prepared to create formatting tools that take advantage of these features. Unless you enjoy a lot of typing!
Grids
An intriguing alternative to the standard Format-Table command, is to use Format-SpectreGrid. Like many of the module's format commands, you need to provide input objects as data.
PS C:\> Format-SpectreGrid -Data @(1,4,7), @(2,5,8), @(3,6,9)

1  4  7
2  5  8
3  6  9
The data elements are provided as arrays and indicate a row. Here's an example with a little more meaning.
PS C:\> Format-SpectreGrid -Data @("1", "Version", $PSVersionTable.PSVersion),
@("2", "Host", $Host.Name),
@("3", "Computername", [Environment]::machineName),
@("4","Running Processes",(Get-Process).Count),
@("5","Running Services",(Get-Service -ErrorAction SilentlyContinue).Where({$_.Status -eq 'running'}).Count)

1  Version            7.5.4
2  Host               Visual Studio Code Host
3  Computername       PROSPERO
4  Running Processes  368
5  Running Services   156
To work with pipelined data, it might be easier to use New-SpectreGridRow to create the data elements and then create the grid.
PS C:\> Get-Process | Where WorkingSet -ge 150MB |
ForEach-Object { New-SpectreGridRow -data @($_.ID,$_.Name,($_.WorkingSet/1MB -As [Int32])) } |
Format-SpectreGrid

27964  brave                    229
28528  brave                    488
9540   Code                     195
24608  Code                     358
38596  Code                     388
18416  Discord                  215
...
This looks like a table, but it's a grid. However, a table is just a grid with a header row. I can also use the module to add color to the grid based on the working set size.
Get-Process | Where WorkingSet -ge 150MB |
ForEach-Object -begin {
    New-SpectreGridRow -data @(
        "[gold1 underline]ID[/]",
        "[gold1 underline]Name[/]",
        "[gold1 underline]WorkingSet(MB)[/]"
        )
}  -process {
    Switch ($_.WorkingSet) {
        {$_ -ge 400MB} {
            $c = "[OrangeRed1]"
            Break
        }
        {$_ -ge 300MB} {
             $c = "[DarkOrange]"
             Break
        }
        {$_ -ge 200MB} {
            $c = "[SandyBrown]"
        }
        Default { $c = "[Wheat1]"}
    }
    New-SpectreGridRow -data @($_.ID,$_.Name,"$c$($_.WorkingSet/1MB -As [Int32])[/]")
} | Format-SpectreGrid

> Run Get-SpectreDemoColors to see available color options.
See what I mean about need to script?
Tables
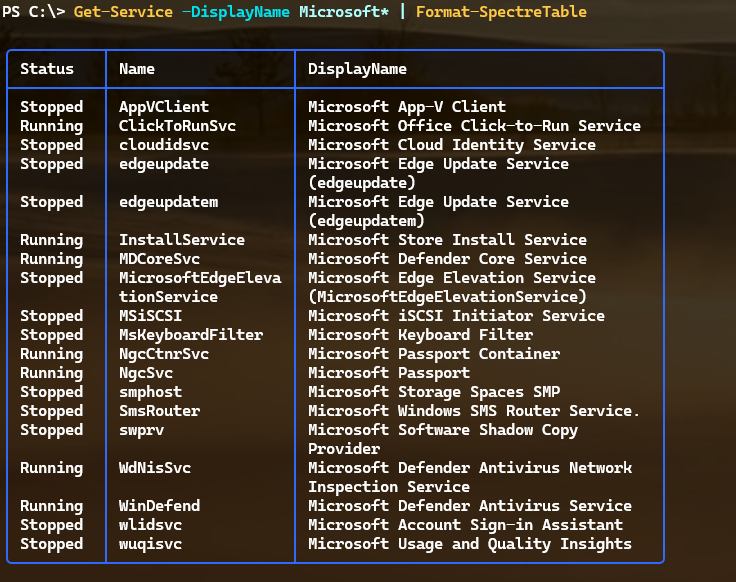
Let's take the next logical step and use Format-SpectreTable to create a table.
Get-Service -DisplayName Microsoft* | Format-SpectreTable
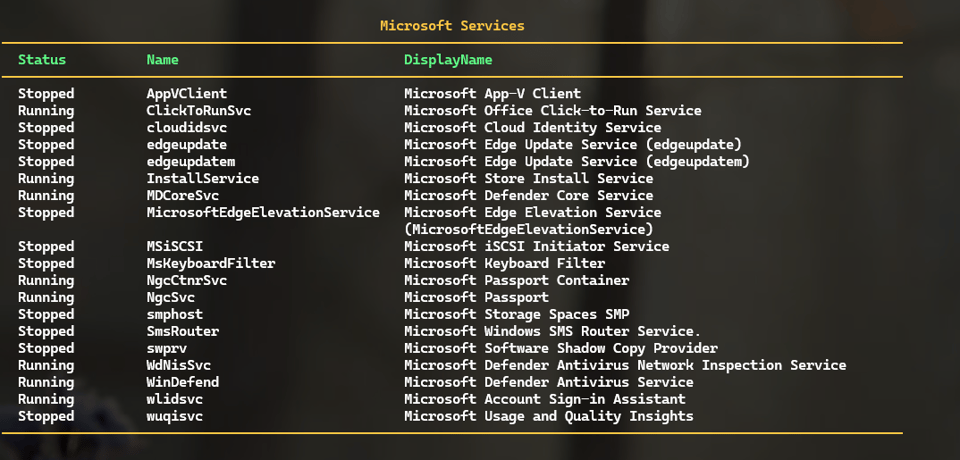
The command offers several parameters to customize the table's appearance.
Get-Service -DisplayName Microsoft* |
Format-SpectreTable -Title "Microsoft Services" -Color "Yellow" -HeaderColor SeaGreen1 -Border Horizontal -width 112
> Use Get-SpectreDemoColors to get a list of available colors.
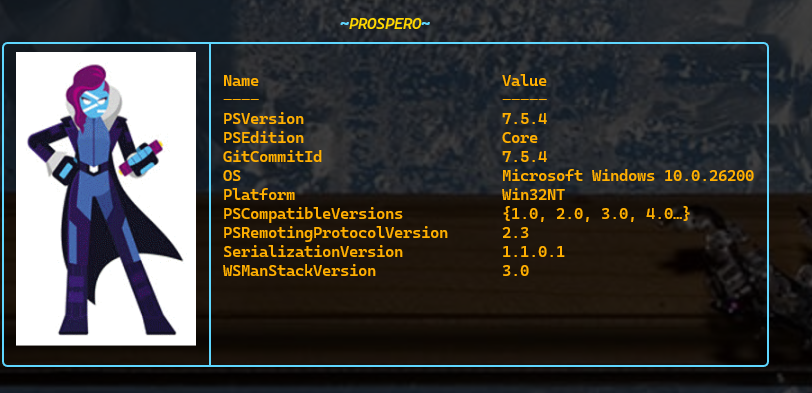
You aren't limited to traditional data tables. You can create any type of table.
[ordered]@{
    Logo = Get-SpectreImage "C:\scripts\MsPowershell.jpg" -MaxWidth 20
    Version = $PSVersionTable | Out-String
} | Format-SpectreTable -HideHeaders -Title "~[Gold1 italic]$($env:Computername)[/]~" -Color "SteelBlue1_1" -TextColor "Orange1"
Charts
Where we can really have fun is by taking advantage of the module's charting features. These commands don't lend themselves to simple pipelined expressions. But I think the results are worth the scripting effort.