A NetAdapter Statistics Alternative
In this issue:
Part of the scripting challenge for April asked you to use tools in the pwshSpectreConsole module to present network adapter statistics. I already showed you a solution using Write-Progress. The point of the challenge was to explore ways to use PowerShell to present information that goes beyond Format-Table.
This is where the pwshSpectreConsole module comes into the picture. The module provides a toolbox of commands that wrap around the Spectre.Console library. You can use these tools to create charts and graphs including bar charts.
Creating Bar Charts
To create a bar chart, you need to begin with a collection of data. The data will be items created with New-SpectreChartItem. As you work with this module, you'll realize that more complicated tasks will require a scripted approach. It is difficult to string commands together in a pipelined expression except for the most simplest of tasks.
To create a chart item you must provide a label, a value, and a color for the bar graph. The color should be a value that you see from Get-SpectreDemoColors.
$data = @()
$data += New-SpectreChartItem -Label foo -Value 34 -Color SlateBlue3_1
$data += New-SpectreChartItem -Label bar -value 88 -Color Aqua
$data += New-SpectreChartItem -Label demo -Value 76 -color GreenYellow
Use Format-SpectreBarChart to display the data. The default behavior is to use the width of the entire console. I often use a percentage.
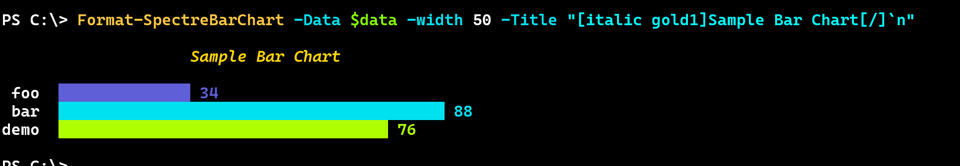
Format-SpectreBarChart -Data $data -width 50 -Title "[italic gold1]Sample Bar Chart[/]`n"
You can also add a label or title. If you really want to get fancy, you can use the SpectreConsole color and formatting shortcuts. In my example, I'm also adding an extra line return to add some space between the chart label and the bar graph.
For our purposes, all we need are values for the sent and received bytes. For the bar chart, I'm going to format the values as MB.
$stat = Get-NetAdapterStatistics -Name "wi-fi"
$sent = [math]::Round($stat.SentBytes /1mb,2)
$rcv = [math]::Round($stat.ReceivedBytes /1mb,2)
$data = @()
$data += New-SpectreChartItem -Label "Sent(Mb)" -Value $sent -Color Aquamarine1
$data += New-SpectreChartItem -Label "Received(Mb)" -Value $rcv -Color LightCoral
See what I mean about needing to put this all in a script?
Presenting the graph is easy.
Format-SpectreBarChart -Data $data -Label "$($stat.InterfaceDescription)`n" -width 100
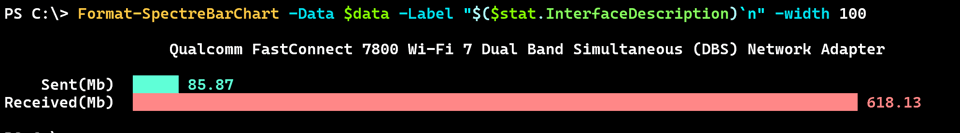
Do you see how I'm using the adapter description for the chart title?
Panel Wrapping
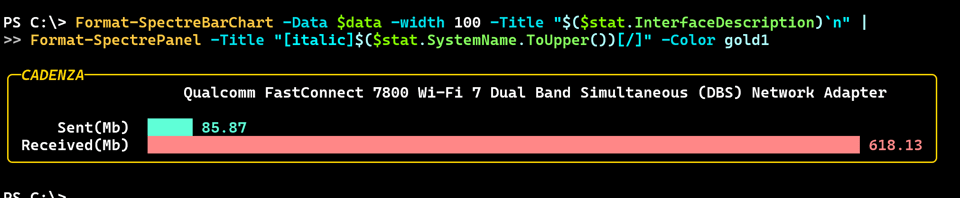
You can take this formatting even further by wrapping the bar chart in a panel. This is essentially a bordered frame that you can stylize with color and even add a title.
Format-SpectreBarChart -Data $data -width 100 -Title "$($stat.InterfaceDescription)`n" |
Format-SpectrePanel -Title "[italic]$($stat.SystemName.ToUpper())[/]" -Color gold1
I'm using the computer name as the panel title.
Invoke-SpectreLive
For "live" monitoring, I could use the same looping structure I used last time. But the pwshSpectreConsole module has another option that makes is easier to run code and generate "live" results. You can use the Invoke-SpectreLive command.
I'll admit the help example can be a little confusing so let's see if my usage is easier to understand.
At the heart of the command is some command or block of code that you want to execute repeatedly. I am going to take the commands I've used thus far and put them into a script block.
$get = {
    $stat = Get-NetAdapterStatistics -Name "wi-fi"
    $sent = [math]::Round($stat.SentBytes /1mb,2)
    $rcv = [math]::Round($stat.ReceivedBytes /1mb,2)
    $data = @()
    $data += New-SpectreChartItem -Label "Sent(Mb)" -Value $sent -Color Aquamarine1
    $data += New-SpectreChartItem -Label "Received(Mb)" -Value $rcv -Color LightCoral

    #add a little padding around the bar chart inside the panel
    Format-SpectreBarChart -Data $data -width 80 -Title "[italic]$($stat.InterfaceDescription)[/]`n" |
    Format-SpectrePadded -Padding 1 |
    Format-SpectrePanel -Title "$($stat.SystemName.ToUpper()) $(Get-Date)" -Color gold1
}
> This is for proof-of-concept testing as I've hard-coded the adapter name.
I'll test my code.
PS C:\> &$get
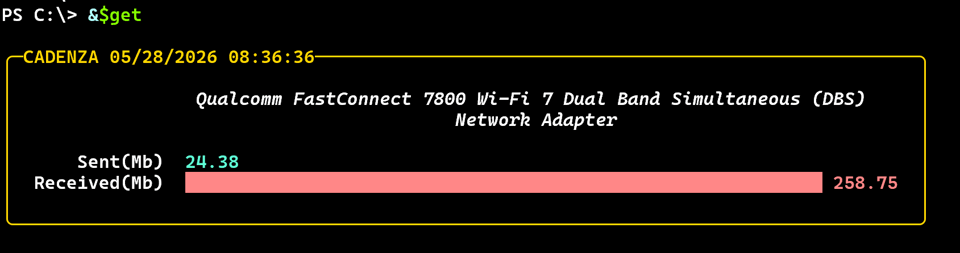
One addition I've made is to insert some padding around the bar chart inside the panel. I also added a time stamp to the panel title. This will be useful when I am running this "live".
To use Invoke-SpectreLive you need to pass an initial result.
PS C:\> $out = &$get
This will be the value of the -Data parameter. You then need to define a script block that will be invoked "live". This script block must have a parameter defined for the context.
param ([Spectre.Console.LiveDisplayContext]$Context)
This is mysterious, black box stuff. I might dive into this at some point to see how it all works. But for now, I'm just going with it. You will need to refresh the context.
$Context.refresh()