🚀 Ha salido Modin 0.14 con numerosas mejoras de código y de documentación. Si utilizas pandas y estás buscando una forma rápida de acelerar tu código con pocos cambios, ¡Modin te interesa!

Read more about the changes in this release in this post!
ponder.io/modin-0-14-rel…
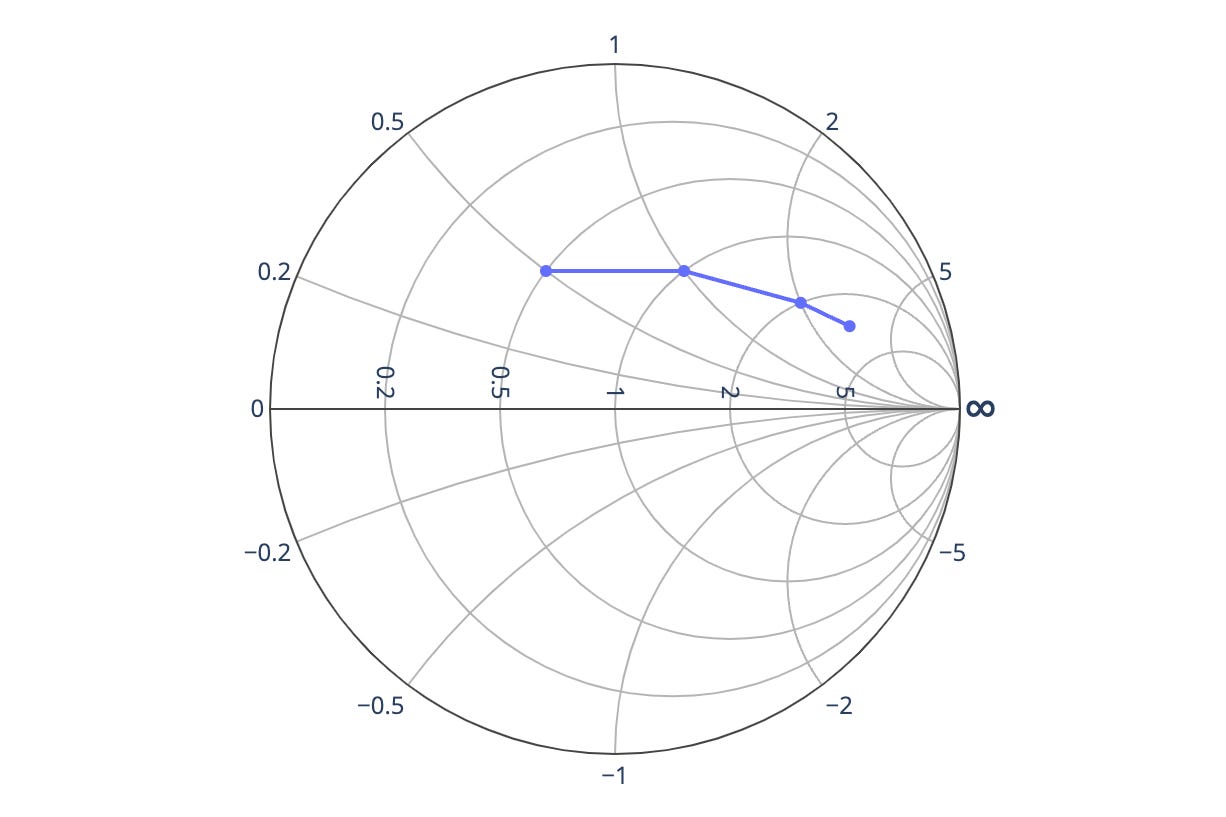
También tenemos Plotly 5.7.0 con numerosas mejoras: facilidades para agregar texto a histogramas y mapas de calor, rellenos con patrones, y ¡diagramas de Smith!
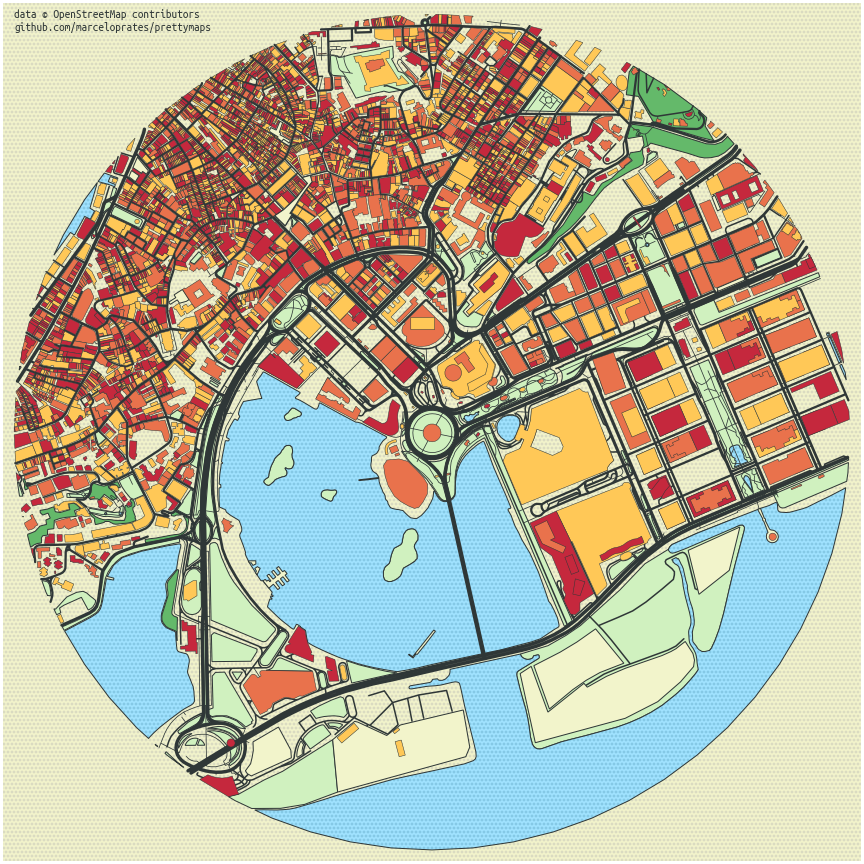
💡 Esta semana ha ido de mapas: he descubierto prettymaps, una biblioteca Python para dibujar mapas con una estética exquisita, y geospatial, una colección de paquetes geoespaciales fácilmente instalables a través de conda/mamba.
📚 La empresa Anaconda ha anunciado una reestructuración de su línea de productos, incluyendo su famosa distribución, que vuelve a llamarse Anaconda Distribution y seguirá siendo gratuita para uso personal.


En otro orden de cosas, me ha gustado mucho este artículo sobre cómo visualizar grandes nubes de puntos utilizando datashader.
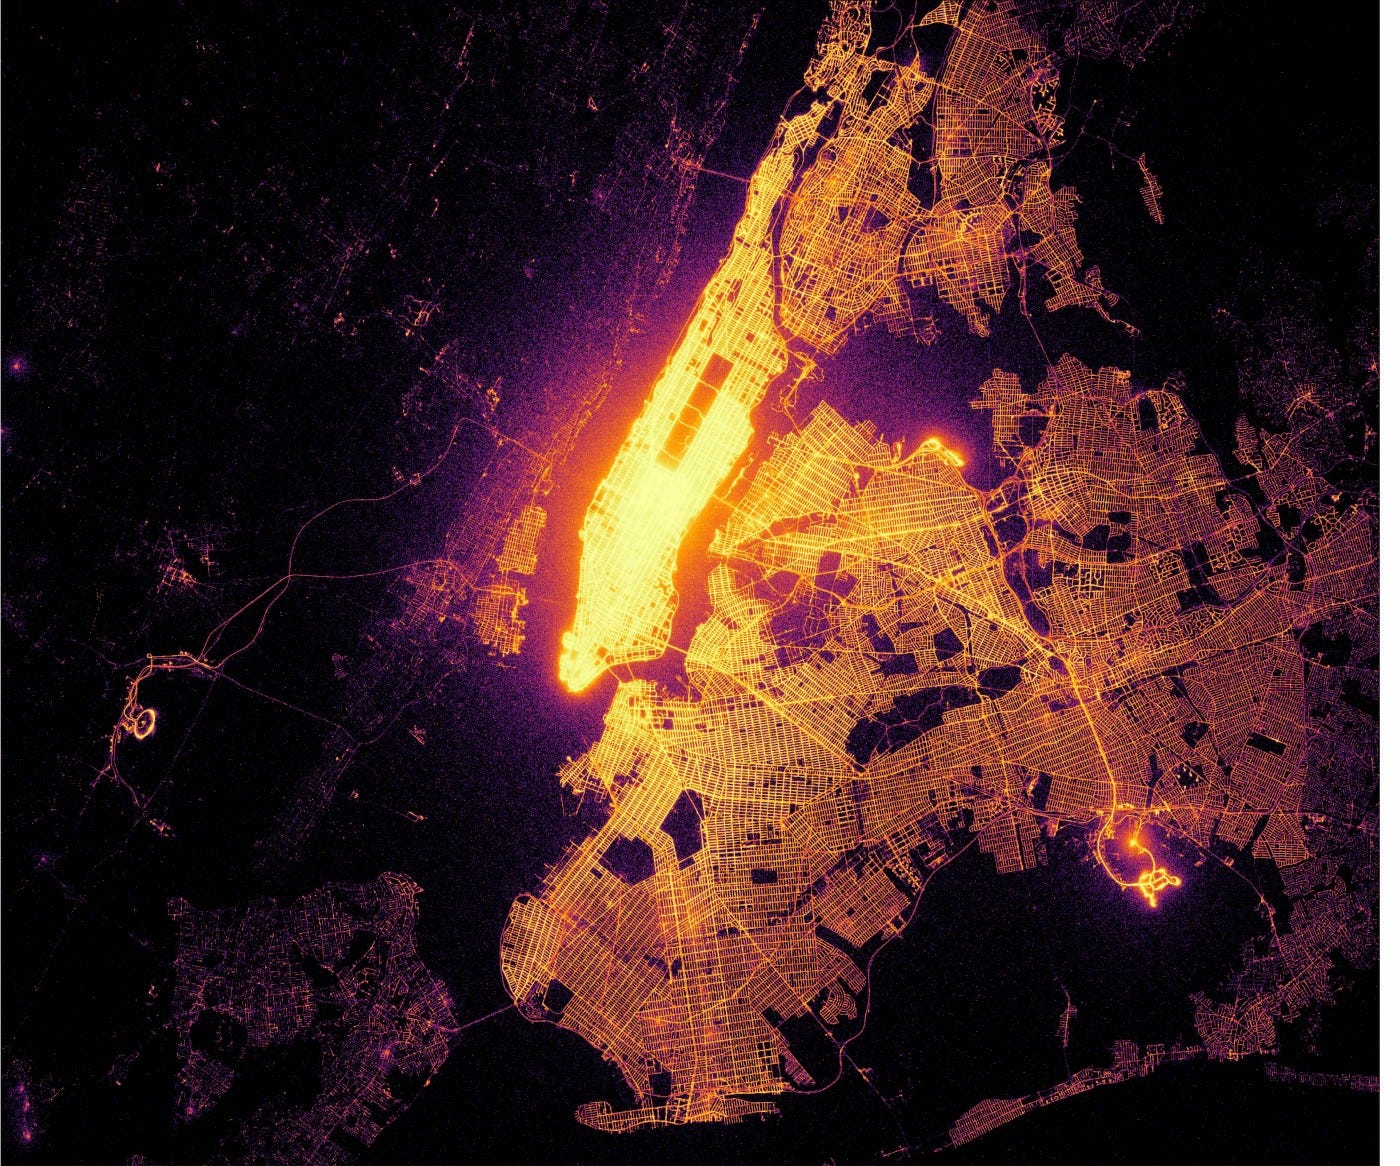
Aunque, como dice aquí Will Geary, ¡ojo con los mapas de calor! Recomendable utilizar la I de Moran, una medida de autocorrelación espacial.

Spatial statistics can help: Local Moran’s I can be used to test for significant clusters and outliers.
#gischat #spatialstats #rstats #pysal

💼 En Orchest, la empresa en la que trabajo, buscamos Python & Kubernetes Engineer (90-120 kUSD + 0.25 % - 0.5 % acciones).
🥳 Cython cumple 20 años, y Stefan Behnel, uno de sus desarrolladores, escribe un artículo para la ocasión. ¡Felicidades!
Acabas de leer la edición #19 de El noticiero de Juanlu. También puedes explorar archivo completo de este boletín.