My #SundaySwing ideas for the week of 5/2 based on #TheStrat
Found some time this weekend, so I started my scanners and here is my #SundaySwing 5/1 issue.
I’m not sure if I have to mention that I expect some more blood? I really tried to scan for some bullish short-term setups but none of the results are worth charting and writing about.
So instead I focus on shorter term Bear trades and we’ll see how this plays out. If market decides to revert or traps some more Bulls, be prepared to switch bias and don’t hold losers to long. Expiration is 5/20 for now.
TLDR;
Blood on the streets, so puts! Short-term expiration, if the market decides to reverse, end the trades immediately.
- $DKNG 5/20 13p < 13.64
- $MU 5/20 65p < 68.02
- $TSM 5/20 90p < 92.77
Since Bear market I do not plan to strictly hold the contracts into expiration or ITM, take profits and move on is the current game for me. Maybe leave some runners. I also, as always, chose cheaper contracts to buy some more and hold a runner after taking profits.
All depends on the actual market situation.
Recap of 4/10 SundaySwing
Last weeks #SundaySwing ideas:
While $IWM worked great and was $3 ITM and of expiration, all the other ideas from this swing list failed, sadly.
Disclaimer: Not advice, instead these are my ideas based on my knowledge analyzing the charts for possible swing trades based on #TheStrat. So please always do your own due diligence before entering a trade.
Chart setups
Since I keep getting questions about the colors in my charts and setups:
- I always chart in multiple time frames Monthly, Weekly, Daily, and 4-hour or 60min
- Purple lines last months high&low
- Orange lines last weeks high&low
- Blueish lines last day high&low
- Green lines are my targets
- Sometimes white and yellow for intermediate targets or 50% rule setups
- The brownish-boxes on the Daily and 4-hour chart you see sometimes show a gap that hasn’t filled yet.
If some of the broadening formation lines looking a bit curved, it’s because I changed the charts to a logarithmic scale, but they are still accurate.
Outlook
As always, lets take a look at $SPY and $QQQ for a rough prediction of what I think the market will do next. Or course, it’s just my interpretation, so keep that in mind!
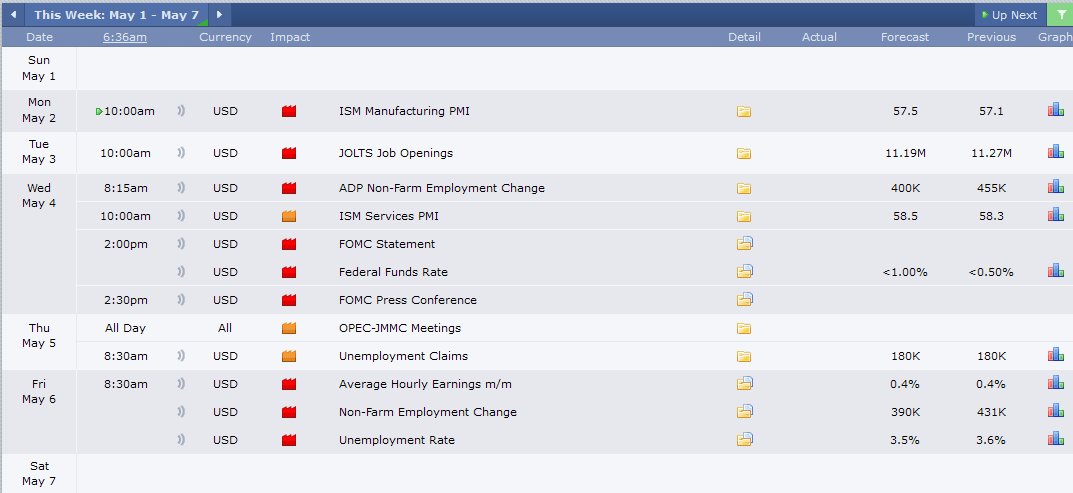
Calendar for this week
Expect some huge volatility upcoming week. FOMC meetings on Wednesday!

$SPY
Obviously bearish, FTFC down, currently so signs of a reversal. Even short-term daily that massive 2d red candle from Friday needs above 425, which is 13 points away as of now.
My last annotated Broadening Formation on the Daily chart didn’t gave any support, we traded right through it, now $SPY aims for that next monthly Broadening Formation bottom at around 400.
Quarter is still inside, but near the 2d trigger at 410.64. Which the next target would be 404.00 from one year ago.
So overall, it doesn’t look great for the bulls and I don’t see any good ideas to being long here.
$QQQ
The big tech earnings we had last week didn’t helped to turn the market around, so as with $SPY, bearish is the way to go here. FTFC is obviously down and $QQQ broke the bottom of the monthly Broadening Formation last week.
Lets see if it can reclaim some losses, but I honestly don’t think so currently.
Longer term, 297.45 triggers Year 2u-2d, which isn’t that far away.
Profits and Stops
I usually target around 25-40% of profits on those swings and decide during the market hours if I leave a runner on a position or close the entire one.
To view the charts in full detail, click to open them in a new browser window.
$DKNG 5/20 13p < 13.64
I was shocked to see $DKNG trading down there, looking at the charts there is still some room to go down. If market remains bearish.
Idea here is to trade the Daily 3-2u-2d from Friday which also is a type of Shooter candle. Weekly and Monthly is obviously a continuation. I selected 5/20 expiration to buy some time, if 13.64 triggers, my targets are 13.06, that would trigger Monthly 3-2d-2d which then has 12.26 from the Weekly chart and 11.37 from the Monthly chart as next targets.
Keep in mind that $DKNG has earnings report on 5/6, so I will probably only old a runner if that contract is in profit during ER.
$MU 5/20 65p < 68.02
Another Daily trigger idea, $MU like the rest of the market was beaten down quite a bit and I see some more downside. The idea here is the Daily 2u-2d Shooter below 68.02. The first target is 67.06. Interesting next one is 65.86 which would trigger another Month 2d. Since $MU already hit its Monthly Magnitude from a while ago (November 2021) this only works if market remains bearish. The targets I marked on the charts below that monthly trigger are all chosen from the Weekly chart.
$TSM 5/20 90p < 92.77
Another semi trade idea, another continuation on the weekly and monthly. Idea here is the Daily 2u-1-2d Shooter below 92.77 from Friday. First target is 91.78 from the Daily chart. The next target 90.22 would also trigger the week and month 2d. Final target if this triggers is on the monthly 84.53.
The above contracts are just my ideas, I sometimes switch to a further expiration or closer to the money depending on the price action we get.
As always, no trigger no trade and stick to your stops!
With that — thanks for reading!
Have a nice green successful week!


