Issue 04: My quest for perfect Core Web Vitals scores
Hi there friend 👋
If you run a blog, work on a project that relies on ranking high on Google Search Engine, or hang around on Twitter and follow a bunch of frontend developers, chances are you might have heard the words Core Web Vitals, thrown around left and right in the past few months. At least on my end, my feed was filled with people showcasing their scores or sharing their concerns with Google rolling out this new metric.
You might have wondered: "what's all the fuss? Why is everyone so concerned about these metrics? How can I improve, bump up those scores the highest possible?"
This issue focuses on answering these questions and also give you some tips I gathered while addressing Core Web Vitals-related pitfalls on my own projects.
What are Core Web Vitals, and why are they important?
Core Web Vitals are a set of metrics that Google considers important when it comes to user experience when loading a website. You might already be familiar with tools like Lighthouse to measure performance and other metrics related to your website, the good news is that if you were measuring those, you were technically tracking those Core Web Vital metrics all along! 🙌. What metrics exactly?
- Largest Contentful Paint (LCP): how long your page takes to load from the user's standpoint.
- First Input Delay (FID): how long it takes for your page to be interacted with.
- Content Layout Shift (CLS): how "visually stable" your page is, i.e. is the content moving around as chunks or images are being loaded.
The real news here is that these metrics are now taken into account when it comes to ranking on Google Search Engine.
Provide a good user experience, i.e. the score of the metrics above are high, and your website will be ranked higher and drive more traffic 📈.
Have low scores, don't address them, and see the traffic of your website slowly go down as time goes by 📉. So now you see why everyone started freaking out when Core Web Vitals were announced 😬.
Striving for higher scores
Like many, I had to address some serious performance pitfalls, especially on my blog where my LCP and CLS scores ended up not passing. My LCP was hovering around 2.8/3.0s (I needed to bring it down under 2.5s), and my pages had a lot of visual distortion, especially since I had a lot of "third party" dependencies to fetch at load time.
As I didn't want to see my blog get de-ranked and sink into oblivion, I focused my work on finding the origin of these issues and fix them to get my scores up.
Let's take a look at some of my attempts to meet the requirements:
- Self-host my fonts. Pulling your fonts directly from websites like Google fonts can be a bad idea performance-wise: it takes time to connect to their server, download the font that's required by render-blocking CSS, thus slowing down your webpage rendering. Switching to self-hosting can bring your LCP score way higher, especially on mobile! If you need a good read about web font related best practices before trying to fix your fonts, I highly recommend Lee Robinson's Web Font post. Just want to check out how I did it on my projects? 👉 I got you: font.css _document.tsx
- Lazy load images. Most recent frontend frameworks promote heavily lazy loading images. Doing so will significantly improve your Core Web Vitals, especially CLS, as most of these image optimization tools will ask you to provide the expected dimensions of your images, thus making your page "visually stable".
- Another potential CLS pitfall that is often overlooked lies in the use of iframes like Twitter, or Youtube. On my blog, it was mostly "Tweets" in my articles that were hurting my CLS as they took a significant amount of time to load, thus moving the content of the page. I solved this by fetching the content of each Tweet at build time, to render an equivalent "Static Tweet" thus improving the reader's experience.
- Reducing page weight. My pages were never "that heavy", especially considering that most of my readers are desktop users, 250kB can seem reasonable. However, on mobile again that's quite another story. After many hours of work, I reduced my articles page weight to around 140/150kB through code splitting and also replacing/removing heavy dependencies. This helped me shave a few extra ms of loading time and increase a bit my scores.
What are the results?
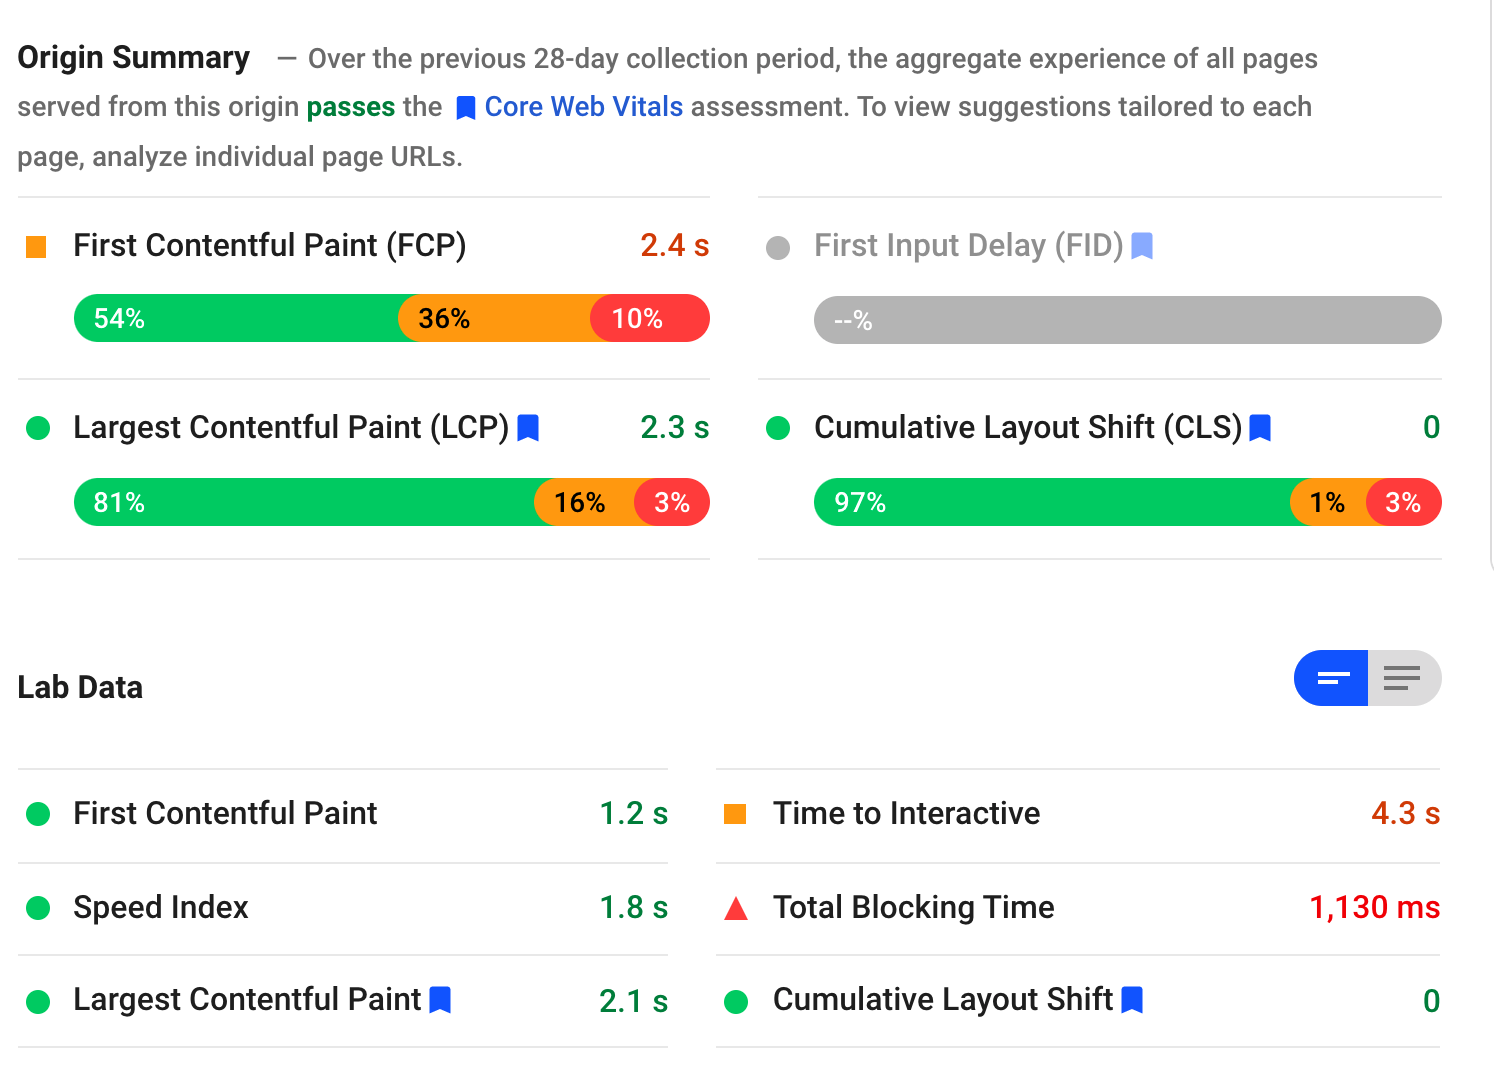
Funny coincidence, while writing these words, I ended up getting an updated result for my Core Web Vitals. In the spirit of transparency, here's a look at the score and see whether my efforts paid off:

As you can see, my metrics are far from perfect, yet I just met all the requirements to pass the Core Web Vital assessment 🎉!
This is an immense relief as I had waited several weeks to validate whether the changes I've made to my blog were going to help me pass the assessment or not! It should also hopefully help drive more organic traffic to my content as I now provide a "good experience" according to Google's metrics:

That’s it for this one! I hope sharing my experience with meeting Google's metrics was helpful to you. Don't hesitate to reply to this email and share some of the steps that you've taken to get your Core Web Vitals up!
Until the next one, have a wonderful day!
Did you like this Maxime's ideas issue? Click here to spread the word and share this newsletter on Twitter. I really appreciate your support!
Want to check out other topics I wrote about? There's a lot of great content waiting for you on my blog 👉 blog.maximeheckel.com