Period 47: Why I’ll never stop talking about Norma
As I continue to educate myself on hormonal contraception, I see a trend: plenty of smaller studies showing that hormonal contraception carries mood-related side effects from depression, to anxiety, to suicidal ideation, to loss of libido. But then I have found several systematic reviews and larger studies that find no such relationships.
This can happen when smaller studies have smaller effect sizes that go away when you look at a lot of similar studies together. And sometimes those smaller studies just aren’t that good.
But there is another reason that systematic reviews looking at a relationship among a sample of, say, 98,000 can fail to find relationships that smaller studies suggest. It’s because, when we scale up that big, we make a lot of assumptions about whose experience is most valuable.
When it comes to hormonal contraception, a majority of people do not have ill effects. Hooray, this is great! And this is a large part of why we should trust these treatments and why we can give them labels of “efficacious” and “safe.” Hormonal contraceptives are both of these things. I am genuinely a fan!
However, when a subgroup has a different experience – especially mood changes with hormonal contraception, which tend to be about depression, anxiety, suicidality, or loss of libido – large scale samples can miss them. This minority experience is sticky and persistent: one paper estimates 4-10% of users have these negative mood experiences1. Because they aren’t a majority experience, sometimes people can be tempted to disqualify them. (Further, because this relates to quality of life rather than efficacy and safety, people can simply minimize their importance, but that’s a conversation for a different post.)
So, I want to talk a little about normative framing in health, especially reproductive health as it affects those with the capacity to get pregnant.
Norma, again
If you’ve read Period (and I hope you have) you will have encountered the story of Norma and Normman, two statues made from the measurements of tens of thousands of “normal” Americans. That chapter, “Norma’s Cycle,” is one of my favorite pieces of writing so I do hope you read the whole thing. But I need to share the punchline of that chapter to help explain why I do… well, everything I do.
The problem of creating these statues came from making the claim that averaging these individuals led naturally to an accurate representation of the average American. Because 1) these “normal” samples were of course exclusive samples – mostly white, ablebodied, etc, but also 2) because it presumes sample distributions are normal and therefore the average value is also where the greatest number of individuals sit. And of course, 3) if you take a bunch of different traits and look at their average values across a large sample of people, it does not follow that putting the average of each of these traits together will in fact produce an overall average person.
A few quick visuals to show you what I mean. Here is a normal distribution:
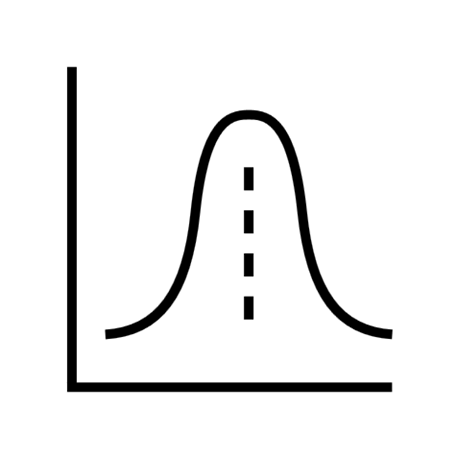
The largest number of measurements sits at the average. But most samples don’t look like this, and in fact we often have to do all sorts of stuff to transform or otherwise statistically manage this when running analyses! Instead they look like this:
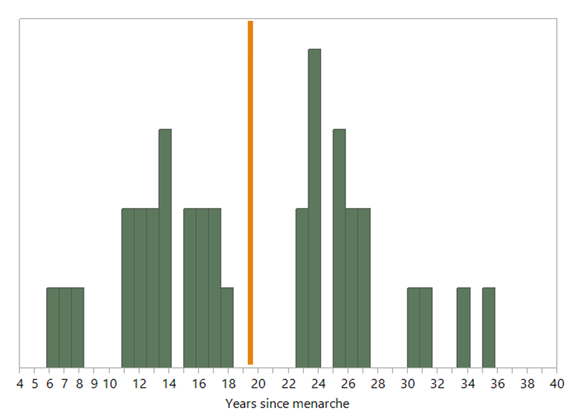
These images represent participants in our Polish field research. In the trait “years since menarche,” the orange line represents the mean number of years since menarche in our sample. Nobody’s there because there is actually a bimodal distribution in our sample.
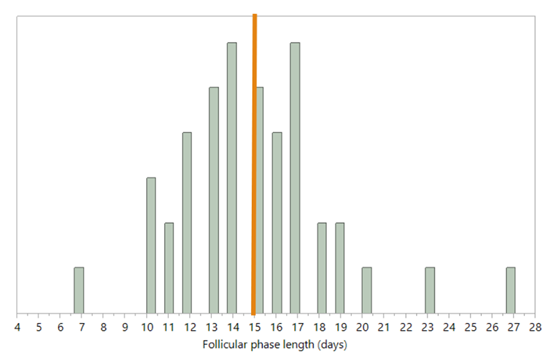
In this other image, of the range of follicular phase lengths in the same sample, you see a left skewed distribution. So not only does the orange line, the average, not represent the most people, there is a long tail to the right of a smaller number of people with longer follicular phases.
Is the average informative here? Depends on your research question. And if anything, what draws my interest as a scientist is why these distributions are shaped the way they are.
For years since menarche, the answer is that most of the people who would fall into the middle of that distribution were ineligible to participate in our research. Why? Well, participants couldn’t be pregnant, lactating, or on hormonal contraception. Folks in the very middle of their reproductive spans are those most likely to be one of those three things!
For follicular phase length, we are looking at a sample of ovulating people of reproductive age. Ovulation has a bit of a tight range in terms of when it tends to happen for most people. And because our eligibility criteria also excluded folks with major reproductive conditions (like, say, PMOS) we should see a cluster exactly where we do, shaded on the earlier side, because someone with a very long follicular phase is someone having a hard time ovulating.
Non-normal distributions, even among human research studies that have tight eligibility criteria, are very common! And if you’re good at your job and care about your participants, you should be wondering, what is going on with those at the margins?
Minority experiences and distribution margins matter
Certain minority experiences have been shown again and again to be robust – those are the ones with which we can start. And it turns out that mood changes with hormonal contraception do show up, again and again. Rather than say, “oh, it only affects a portion of patients,” we should ask “what are the factors that increase someone’s risk of this side effect?”
Thankfully several groups are already publishing on this. Some have shown that, consistent with the MRI research I shared a few newsletters ago, young HC use is a risk2. Others find that preexisting mood disorders increase the risk of negative mood changes with HC use2,3. Another group showed that people who report adverse childhood experiences have an increased risk of mood changes with hormonal contraception as well, most notably decreases in sexual desire4.
Something my own work has suggested (many years ago, from a series of focus groups I ran on the topic) is that an issue that reproductive autonomy from efficacious contraceptive use can provide confidence and positive mood – that is, when you know and trust that what you’re using will prevent pregnancy you are understandably happy about it! HCs, when used as prescribed, are among the most effective options we have for preventing pregnancy. When that is the most important thing on your mind, then HCs will give you confidence, a sense of control in the preventing of an outcome that may be completely untenable. This is why people also tend to be big fans of sterilization when they choose it – it’s a method that one can really trust to work! How high ranked the need to prevent pregnancy is in an individual’s decisions around contraception will therefore attenuate any other possible mood effects, something that’s been borne out in the literature5.
Rather than say that no mood changes is the normative experience, we should do the better work of noticing the multiple possible ways hormonal contraception affects mood across a variety of people, with a variety of risk factors and priorities.
“Normative,” when it comes to humans, really should mean “variable” rather than “average.” The environments, lived experiences, families, and more to which we are exposed create any number of impressions on our bodies, creating ever more possibilities for what it means to be a person. The margins matter, the average matters, and everything in between.
References
Tronson, N. C. & Schuh, K. M. Hormonal contraceptives, stress, and the brain: The critical need for animal models. Frontiers in Neuroendocrinology 67, 101035 (2022).
Lundin, C., Wikman, A., Bixo, M., Gemzell-Danielsson, K. & Poromaa, I. S. Towards individualised contraceptive counselling: clinical and reproductive factors associated with self-reported hormonal contraceptive-induced adverse mood symptoms. BMJ Sex Reprod Health 47, e1–e8 (2021).
Lewis, C. A. et al. Effects of Hormonal Contraceptives on Mood: A Focus on Emotion Recognition and Reactivity, Reward Processing, and Stress Response. Curr Psychiatry Rep 21, 115 (2019).
Novick, A. M. et al. Discontinuation of hormonal contraception due to changes in mood and decreases in sexual desire: the role of adverse childhood experiences. European Journal of Contraception & Reproductive Health Care 27, 212–220 (2022).
Oddens, B. J. Women’s satisfaction with birth control: a population survey of physical and psychological effects of oral contraceptives, intrauterine devices, condoms, natural family planning, and sterilization among 1466 women. Contraception 59, 277–286 (1999).


Add a comment: