A new case study and working with monthly data
A Friday forecasting update for you all this week!
It is another double header with two pieces of content:
- A case study with Ian Daniels (@surfpunkian on Twitter). Ian works a lot with the Adobe analytics stack and needed to quickly make a forecast in order to get a sale across the line before the end of Adobe’s financial year.
- The most requested feature is now live: You can now work with monthly data in Forecast Forge! I think this is the biggest improvement to the tool since I launched
1. Estimating ROI during pre-sales with Ian Daniels and reallymoving.com
The forecasting was such a key part of getting that buy in. Turning it around in three days with the level of detail we did wouldn’t have been possible without Forecast Forge.
You can watch a video of Ian and I talking about his use of Forecast Forge on youtube: https://youtu.be/hGm9Csk63iM
Ian Daniels is a director at a UK customer experience and digital agency. A lot of their work is with the Adobe experience cloud and they are experts at the implementation and itegration of these products.
In November 2020 they were in discussions with reallymoving, a comparison site and aggregator for home moving services (e.g. solicitors, surveyors etc.). Because of Ian’s large amount of experience in this area he knew that reallymoving could expect at least a 13% uplift in revenue from the type of analytics investment he was proposing.
But in order to help reallymoving understand the ROI of this investment he needed to know what the baseline scenario, without any uplift, was. There had been significant changes in demand (in both directions!) for reallymoving’s services during 2020 because of lockdowns so being able to plan what this might look like in 2021 was very important for understanding what the ROI would look like.
Clients want to know their return on investment, particularly if they’re going to be putting large chunks of cash into enterprise technology. And Forecast Forge is a really quick way to help them figure out what that might look like.
And, as an extra complication Adobe were offering reallymoving a significant discount but this offer was extremely time limited; the deal would have to be completed before the end of Adobe’s financial year.
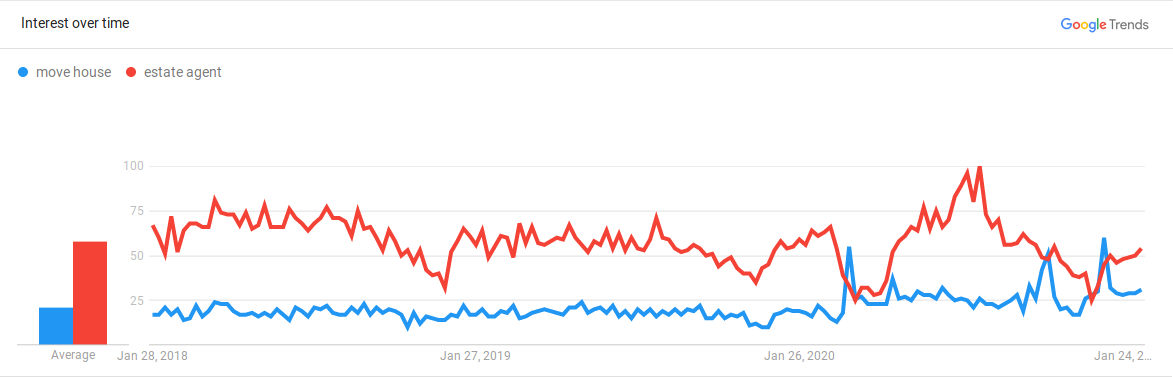
Google trends data showing searches for “move house” increasing during UK lockdown but searches for “estate agent” decreasing.
In the UK, covid has had two main effects on house moves:
- A reduction in demand during lockdowns when it is harder for people to view houses.
- An increase in demand outside of lockdowns caused by a reduction in tax (the “stamp duty holiday”). Ian’s challenge was to quickly present forecasts for a variety of lockdown and stamp duty scenarios so that reallymoving could make an informed choice about their analytics investment.
Ian used two regressor columns; one to show when lockdowns were happening and one for the duration of the stamp duty holiday. In both cases he knew when these had occured in the past and could present different scenarios by editing the values for the future.
For example, he could explore the impact of another lockdown starting in January or the stamp duty holiday being extended into the Summer.
The Results
Ian was able to put together a board pack containing the forecasts and the business case for the new analytics investment (which would pay for itself within the first year). reallymoving decided to really move forward with their analytics implementation.
Within three days we were able to help them put together a board pack and a business case that modelled the uplift.
Ian was also able to involve reallymoving more closely in the forecasting process:
It was quite a collaborative process. Having the forecasts available in a shared spreadsheet so everyone could be more involved and add data in if they wanted to was really important for transparancy and building up trust.
Using Forecast Forge to make the forecast also freed up enough data science time for some awesome work on other projects.
He spent his time building a coverage API integration into Ad Cloud so that they can change their their bids by the coverage that they have in postcode regions […] He was able to create something super valuable to the business because we were providing the forecasts with Forecast Forge.
2. Monthly Forecasts and Missing Data
One of the most requested feature since Forecast Forge launched has been the ability to forecast from monthly data and not just daily data.
Daily data is really easy to export from Google Analytics and other tools but at a more strategic level no one cares very much about what performance on 14th July looks like as long as July as a whole is doing OK. When planning for the year or months ahead it is much more normal to set a monthly target rather than look at things day by day.
My personal opinion is that working with daily data gives will give better results when you start adding helper columns - particularly helper columns that have an effect on a particular day (this is most of them in my experience). But it is also tedious to make a quick daily forecast and then have to aggregate the results to a monthly level before presenting them to a client or boss and I want to remove as much tedium as possible for my users.
 Typical Forecast Forge user realising they need to convert from a daily
forecast back to monthly data. (and torching my carefully calibrated predictive
intervals in the process)
Typical Forecast Forge user realising they need to convert from a daily
forecast back to monthly data. (and torching my carefully calibrated predictive
intervals in the process)
The second thing I wanted to improve was how Forecast Forge handles missing data. This has cropped up a couple of times in my conversations with Dipesh and, most recently, in a clubhouse chat with the team at Erudite.
The problem comes when you try to handle both of these things together; how do you tell the difference between monthly data and daily data with a lot of data missing?
 Monthly data? Or a lot of missing data?
As far as I know there is no reliable way to tell these two situations apart.
Why is it even important to be able to tell the difference?
Forecast Forge uses a database of holidays to make the forecasts better. Holiday effects are, by default, applied at the daily level. So, for example, the Easter Sunday effect will be applied on Sunday 4th April in 2021; it won’t be applied across the whole month of April.
But for a monthly forecast we do want that effect to be applied across the whole month. The forecasting process is different for monthly forecasts - just doing the same thing as for a daily forecast would not give the right result.
An aside about one reason why working with daily data is better:
In 2029 Easter is on the 1st April so Easter and Good Friday will be in different months for the first time since 2018. Forecast Forge has both a Good Friday effect and an Easter Sunday effect; unless you have data from 2018 when you make your 2029 forecast then Forecast Forge will have no idea what the difference is between the Easter Sunday effect and the Good Friday effect. In most years this won’t have mattered but in 2029 the Easter Sunday effect needs to be applied to April and the Good Friday effect to March.
The solution
Only having daily data for the first of every month and the rest of the data
being missing is very unlikely. If you make a FORGE_FORECAST forecast where
every date is on the first of the month then you’ll get a monthly forecast.
Otherwise you’ll get a daily forecast (possibly with missing data).
Other Improvements
The old version of FORGE_FORECAST would look at the difference in the number
of rows between the dates argument and the metric argument. Then it would
forecast this many days into the future.
The new version looks at the actual dates in the future period and then returns the forecast for those days.
The combination of these two things is what makes the new version of the forecast so much better. Compare here how they forecast on monthly data:
What can you do with this?
There are a few other things you use this for beyond making monthly forecasts.
1. Forecast only specific days in the future
If, for example you are only interested in forecasting the run up to Valentine’s day 2022 you can do that.
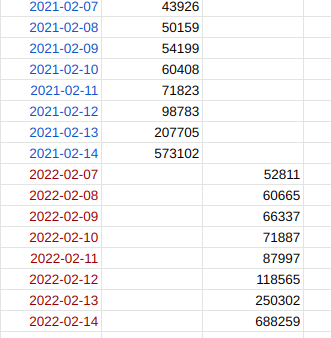
This won’t make the forecast any more (or less) accurate than forecasting the intervening 358 days but it might make your spreadsheets a little bit tidier and easier to manage.
2. Remove days with bad data
Sometimes, the best thing you can do with bad data is just ignore it.
![]()
In this case, the days with zero transactions are because of broken tracking rather than because there were actually no transactions. If these days are included in the training data for the forecast the algorithm doesn’t know it is because the tracking is broken; it just sees a few days with zero transactions
This means the forecasted values will be lower than they should be.
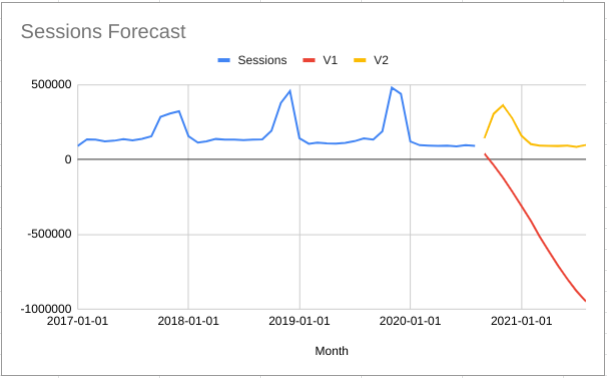
Compare the V1 and V2 forecasts in this chart:
![]()
The V1 forecast uses the old method and the forecasted values are lower
because the forecasting algorithm takes into account that the number of
transactions has been zero for seven days in the recent history.
For the V2 forecast I simply deleted the rows with bad data and the
forecast is higher because the algorithm has not seen seven days of zero
transactions. The data for these days has no influence on the predictions.
The forecast is worse in some way than a forecast made from complete, high quality data; too much missing data will cause a much wider predictive interval and possibly very strange predictions. But, in this case, it is better than a forecast made with all the data available because some of this data is of poor quality and not reflective of what actually has been going on.
Limitations
At the moment this is only available with the FORGE_FORECAST and
FORGE_CUMULATIVE_FORECAST custom functions. It is not available in the
sidebar yet; this is because of how the sidebar calculates and displays
estimates of the forecast accuracy. I will update this next week.
If, for some reason, the updated forecast is not working for you then:
- Please let me know (fergie@forecastforge.com)
- You can use the custom functions
FORGE_FORECAST_V1andFORGE_CUMULATIVE_FORECAST_V1to still get access to the old method. These are hidden functions so they will not appear in the function autocomplete but, as long as you haven’t made a typo, they will work just the same.
I realise this is two announcements jumbled up into one, but I thought it easiest to explain what was going on behind the scenes with both of them together. I’ll update the learning documentation to explain them both separately.