Searching For Statistical Easter Eggs
For those of you who have been following along, today is the day I reveal my identity to my little. I have spent all week working to convince her that I am not her big and it has paid off. She has no idea and I cannot wait to see the look on her face tonight. Besides that, this week has flown by, but I guess that happens when it starts on Wednesday.
I received my client for Statistics and Data Science Consulting, and I am very intrigued by their mission. While I cannot say much on it, I think that the project is important and would be very beneficial to the community. We are also starting to work with our nonprofit partners in my marketing class. I was assigned PFLAG Danville. The organization works to educate, support, and advocate for the local LGBTQ+ community. That project will focus a lot more on the marketing and business side of consulting while my project for this class is much more analysis heavy. I am glad that college has given me the opportunity to experience these different versions of consulting work, as I know I want to pursue a career in this line of work. I’m just not exactly sure how data heavy I want my career to be.
Besides starting my client projects, I have mostly been studying for some upcoming exams. I am the type of person who NEEDS background music to do my work, so there was a lot of Taylor Swift listened to (shocking, I know). Now, imagine how happy I was when looking through episodes for Stats + Stories and I found one based on the Eras Tour. As a victim of the Great 2022 Ticket Master War, I had to pick that episode. It was titled “Taylor Swift and Markov Chains”.
The episode featured Marina Ferrari de Aquino Klemm and Charlotte Jones-Todd. These women had recently published an article in Significance, titled “We Were in Screaming Color: Colors of the Taylor Swift Universe—A Statistical Story”. First of all, an amazing name, I am immediately intrigued. Taylor Swift and statistics, literally my dream. In the article and podcast, they talked about how they analyzed EVERY line from Taylor Swift’s surprise songs and assigned them as either positive, negative, or neutral. After each song got an average score, they found out what color Swift wore when she sang them. Interestingly enough, they found that colors like green and yellow were more often worn for sad songs while colors like pink and blue were often worn with happier songs. Now, I am all for falling down the rabbit hole of Taylor Swift Easter eggs, but this seems like a lot of thought into which color dress she wore. Still, it is an interesting pattern and makes you wonder how deep her puzzles go.
Beyond the basic analysis, Ferrari de Aquino Klemm also created a Shiny app that is available on GitHub. You can pick a color and what topic the songs should be on and it will generate a playlist for you. Spotify has a feature that creates AI playlists from a prompt, but the fact she went through each song and cataloged them by hand to create this Shiny App is dedication. I thought that I was a major swiftie, but she puts me to shame.
My only experience with making a Shiny App was in STAT230. We were making a dashboard to show confidence intervals, and I created a demonstration of how intervals change by percent. It was so annoying to make. My variables never liked to work with the menus, and I could never get the display to format properly. I am just grateful we have not had to touch Shiny Apps in this class, our packages were enough for me.
Overall, I was impressed by how these women used categorical data to identify patterns between song themes and the colors Taylor Swift wore. It also made me think about how statistics can be applied to marketing, where so much of the data I will work with is categorical and understanding patterns in consumer behavior is essential. While I may not be analyzing Taylor Swift’s wardrobe in my future career (although I certainly wouldn’t complain), this project showed me how creative data analysis can be and how even seemingly random information can reveal interesting trends. I think that is one of my favorite things about statistics. There are so many ways to approach a question, and sometimes the most unexpected ones lead to the most interesting results.
I wrote this newsletter before my reveal but did not get a chance to send it until after. Turns out I did not have my little fooled in the slightest and she knew it was me the whole time.
Until Next Week,
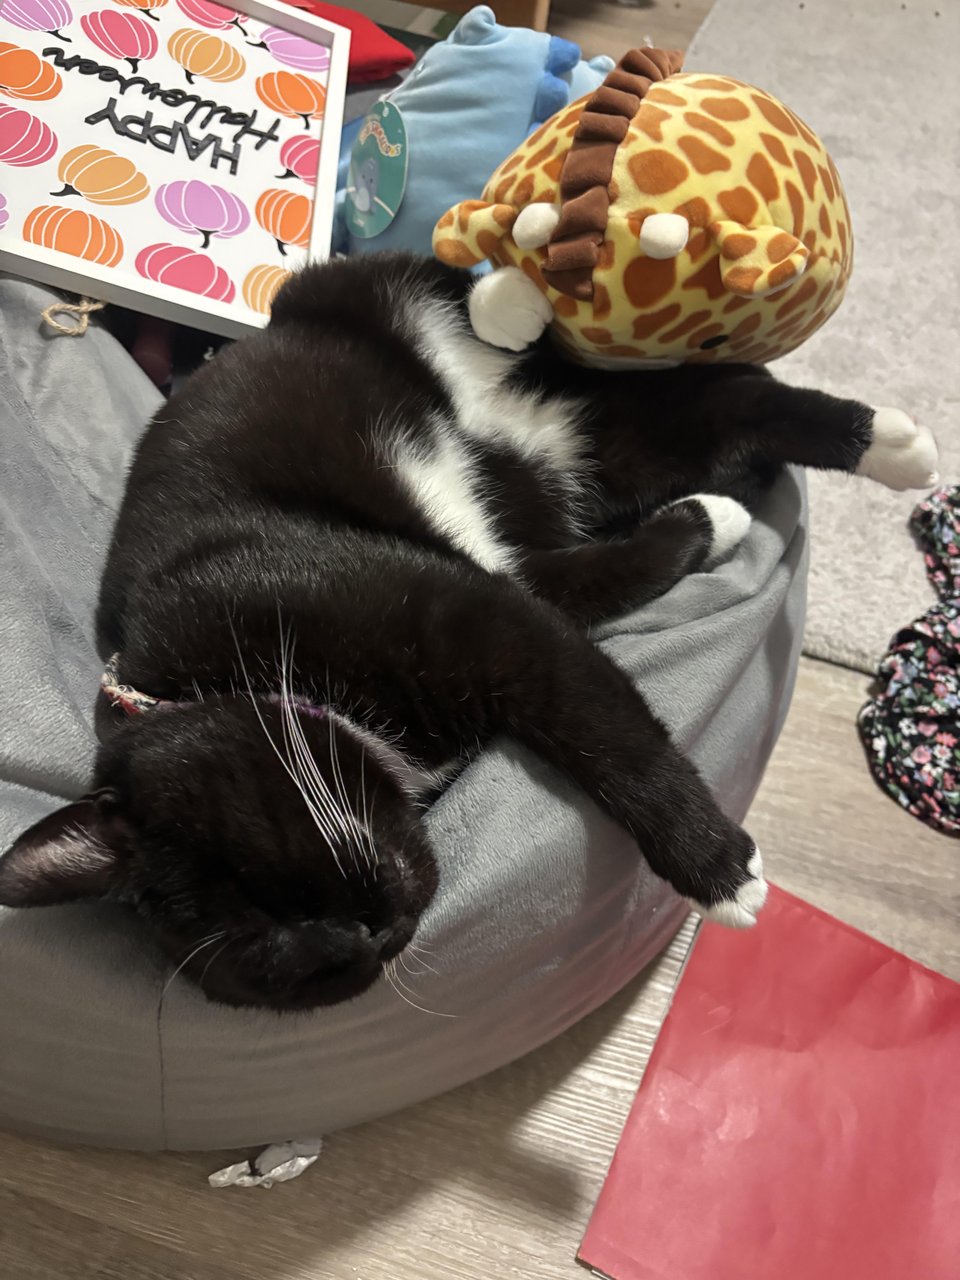
Aylee and Binksley